
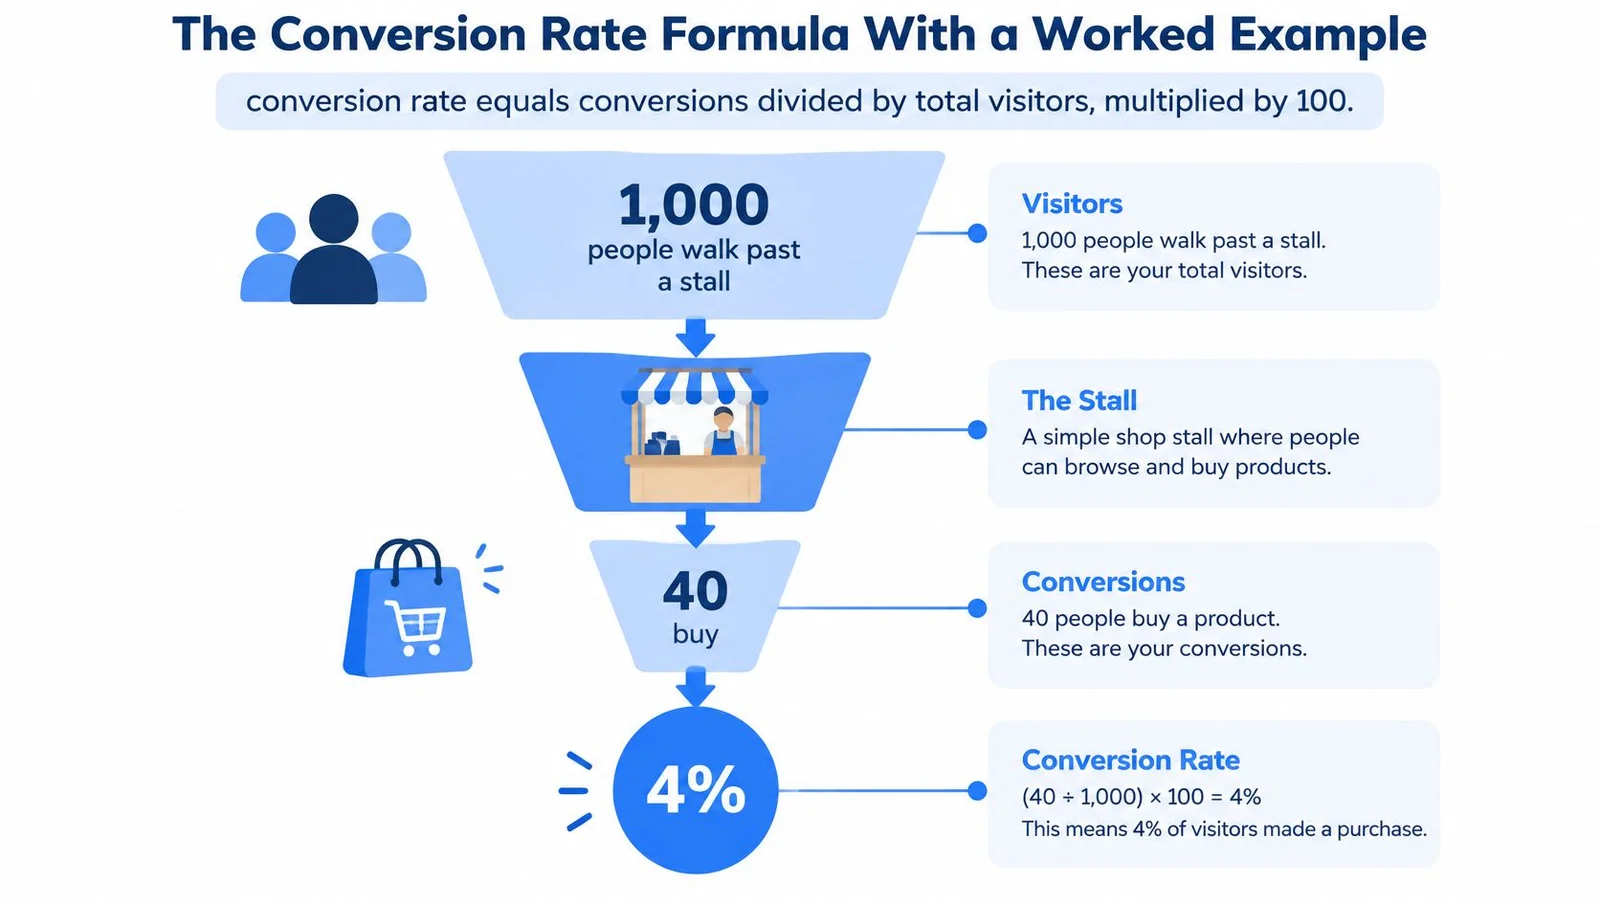
Conversion rate equals conversions divided by total visitors, multiplied by 100, so if 1,000 people visit a page and 40 sign up, the rate is 4%. That one formula is simple. The confusion starts when you try to compare your number with someone else's.
You've probably looked at a dashboard and wondered whether 3%, 5%, or 9% is good. Maybe a colleague shared a higher number from a different page, or a tool promised a lift without saying what counted as a conversion. The number itself doesn't answer you. You need to know the page, the conversion event, and the audience behind it. If you want a quick frame for what a good conversion rate looks like, start there before you chase someone else's headline number.
Think of conversion rates in marketing as labels on measuring cups. Two cups can look similar but hold different amounts. If one person counts unique visitors and another counts sessions, or one counts trial signups and another counts purchases, you're not comparing the same thing. Once you fix those choices, the numbers become useful, and you can test changes with confidence.
The Conversion Rate Formula With a Worked Example
Start with a shop. If 1,000 people walk past a stall and 40 buy, the rate is 40 ÷ 1,000 × 100 = 4%. Nothing about the stall's design changes that math. It tells you what share of people took the action you counted.
Now use a SaaS pricing page. Say it receives 1,200 unique visitors in a week and 48 people start a trial. Your signup rate is 48 ÷ 1,200 × 100 = 4%. If you later count paid subscriptions instead of trials, you'll get a lower number, but the page hasn't suddenly become worse. You've changed the event. The same discipline applies when you measure a product page conversion rate: keep the event fixed before you compare weeks.
The visual below shows that same movement from visitors to buyers in funnel form. For stage-by-stage numbers, see our guide to funnel conversion rates.
Pick Your Denominator First
The bottom number in the formula is called the denominator, and it's where many arguments begin. Unique visitors counts each person once in your chosen period. Sessions counts visits, so one person who returns three times adds three sessions. Clicks counts people who clicked an ad or link, even if the page never loaded properly.
Those choices produce different rates from the same activity. A returning buyer who visits four times before purchasing will raise your session count without adding four people. For a one-time action such as creating an account, unique visitors usually match the question better. For an online store where someone can buy on separate visits, sessions can make more sense.
Match the Formula to the Goal
| Goal | Formula |
|---|---|
| Signup rate | Signups ÷ unique visitors × 100 |
| Purchase rate | Orders ÷ sessions × 100 |
| Course enrollment rate | Enrollments ÷ page visitors × 100 |
| Webinar registration rate | Registrations ÷ landing-page visitors × 100 |
| Add-to-cart micro-conversion | Add-to-cart actions ÷ product page visitors × 100 |
Say a course page gets 800 visitors and 56 enrollments. That's 7%. A webinar page with 800 visitors and 160 registrations is 20%, but registering is free and enrolling costs money. The webinar page isn't automatically better. It's asking for an easier action.
Practical rule: Pick one denominator and one event for each page, write both down, and keep them fixed when you track changes over time.
That discipline sounds basic, yet it's what makes every later comparison fair. If your definition changes halfway through a month, you can't tell whether the page changed or your ruler did. Clean conversion tracking (and a shared definition of CVR in digital marketing) is what keeps the ruler honest.
Conversion Rate Benchmarks by Industry and Channel
Two landing pages can attract the same number of visitors and still have very different conversion rates. The offer, audience, and action all matter, so a benchmark is useful only when it measures something comparable to your page. Pair this with our landing page conversion rate benchmark when you need page-type context beyond the industry median.
In Unbounce's 2024 Conversion Benchmark Report, which analyzed more than 41,000 landing pages, 464 million visitors, and 57 million conversions collected from July 2023 to July 2024, the all-industry median conversion rate was 6.6%. A median is the middle value: half of the pages converted below it and half above. Unlike an average, it is less affected by a small number of unusually high results.
Find the Row Closest to Your Page
| Industry | Median conversion rate | Gap to all-industry median | What to note |
|---|---|---|---|
| All industries | 6.6% | Baseline | Half of pages convert above this figure |
| Entertainment | 12.3% | +5.7 points | Highest median in the dataset |
| Education | 8.4% | +1.8 points | Course and enrollment pages |
| SaaS | 3.8% | -2.8 points | Signup, trial and demo pages |
| Ecommerce | 4.2% | -2.4 points | Product and category pages |
The range is broad: entertainment pages had a 12.3% median, compared with 8.4% for education, 4.2% for ecommerce, and 3.8% for SaaS. The 8.5-percentage-point gap between entertainment and SaaS is about 2.2 times the SaaS median. The entertainment median itself is about 3.2 times the SaaS median. Store teams can dig into the average conversion rate for ecommerce, while product-led teams often compare against a SaaS landing page conversion rate for trial and demo pages.
Those figures describe different kinds of decisions, not different levels of marketing skill. An entertainment page may ask visitors to watch or register, while a SaaS page may ask them to start a trial or book a demo. Education pages can involve comparisons between instructors and start dates. Each action carries its own amount of friction.
What the Benchmark Does Not Tell You
The benchmark measures landing-page conversions per visitor, but the conversion event can vary by page. It might be a signup, enrollment, or registration, rather than a completed purchase. Define the event precisely before comparing rates.
Audience and page context matter, too. A pricing page visited by existing leads is a different comparison from a campaign page aimed at new prospects. A free webinar registration page also asks for less commitment than a checkout page.
For paid search and email, use your trailing four-week rate for the same page, event, and channel as the working benchmark. That gives you a consistent reference for judging changes on that page, rather than comparing unlike audiences or actions.
How to Measure a Conversion Lift Accurately
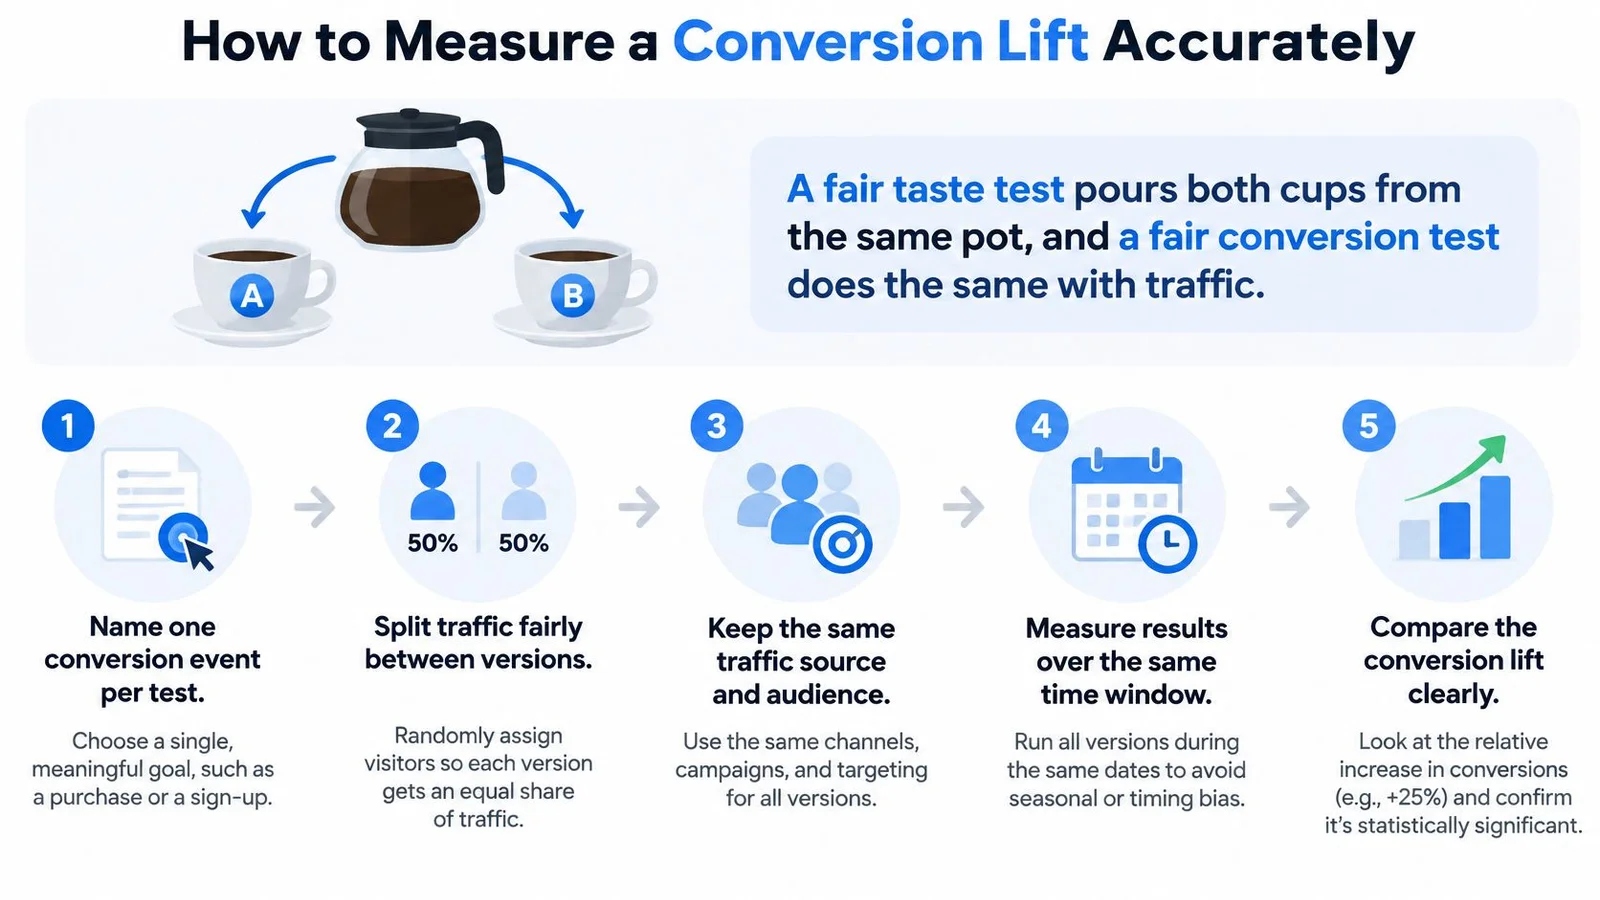
A fair taste test pours both cups from the same pot. A fair conversion test does the same with traffic, giving each version a similar mix of visitors during the same period. If one version gets weekend bargain hunters and the other gets weekday business buyers, you haven't tested the page. You've tested the calendar.
The process below gives you a clean way to measure change on one page.
Seven Steps for a Fair Test
- Name one conversion event per page. Choose signup, enrollment, registration, or purchase, because mixing events hides what changed.
- Record a baseline for at least four weeks. A full cycle balances weekday and weekend patterns and reduces the effect of one unusual campaign.
- Split incoming traffic randomly. Send comparable visitors to the current page and changed version, or hold out a group that never sees a new widget.
- Keep the measurement identical. Use the same event, time window, and denominator for both groups.
- Report absolute and relative lift. State both numbers so readers don't confuse percentage points with percent change.
- Check guardrails. Watch bounce rate, page load time, refunds, activation, or attendance, because a higher signup rate can still bring weaker customers.
- Set the sample size before launch. Estimate it from your current rate and the smallest lift worth detecting, then run to that size instead of stopping when one group looks ahead.
If you're planning the split itself, our guide to A/B/n testing helps you decide how many versions your traffic can support, and what split testing is covers the single-change case. When the goal is broader than one page test, start with what conversion rate optimization is. For a deeper measurement walkthrough, Cometly's guide to conversion lift is a useful companion when you define exposed and holdout groups.
A move from 4% to 5% is one percentage point of absolute lift and a 25% relative increase. Both statements are true, but they answer different questions.
That distinction prevents inflated claims. A team that reports only "25% lift" may sound like it gained 25 points. A team that reports both figures lets you judge the business value. On 10,000 visitors, one extra point means 100 more conversions.
The video below walks through the same comparison visually, with attention to keeping both groups equal.
Why Old and New Benchmarks Are Not a Time Series
History offers a warning. A summary in Digital Applied's conversion rate benchmarks guide reported a 3.2% median landing-page conversion rate for data collected from October 2018 through October 2019, while the later 2024 benchmark reported a 6.6% median. Taken at face value, that's a 3.4-percentage-point increase and approximately a 106% relative rise.
Don't read that as proof that landing pages became twice as effective. The studies may differ in page samples, industries, traffic mix, conversion definitions, device usage, and platform users. They're separate snapshots, not a controlled time series following the same pages.
Your safer comparison is narrower. Measure the same page, same event, and similar traffic before and after a change. That won't make headlines, but it will tell you whether your change helped your visitors.
Attribution When Buyers Decide Off-Site
Say a visitor watches a webinar reaction, asks a pricing question on your product page, then leaves to compare two alternatives. Three days later, she types your web address directly and enrolls. Last-click reporting gives the credit to that final direct visit, so the webinar and product page look idle even though they shaped the decision.
This is the attribution problem. Your analytics see tracked sessions, but buyers also read reviews, talk to colleagues, search again, and ask AI tools for summaries. No single model captures all of that correctly. Each model answers a narrower question.
| Model | How credit is assigned | Strength | Blind spot |
|---|---|---|---|
| Last-click | All credit to the final tracked touch | Simple and fast to report | Ignores the touch that started the decision |
| First-click | All credit to the first tracked touch | Shows which sources start journeys | Ignores proof and objections handled later |
| Linear | Equal credit to every tracked touch | Balances the whole path | Treats a casual visit and a demo request alike |
| Assisted conversion | Credits touches that appear earlier in the path | Reveals helper channels | Still depends on tracked sessions |
| Randomized holdout | Compares exposed and unexposed groups | Shows causal lift | Needs enough traffic and planning |
| Post-conversion survey | Asks buyers what influenced them | Captures off-site influence | Self-reported and sometimes vague |
What Tracked Reports Miss
In Omniscient Digital's 2025 organic growth research, a survey of 170 U.S. marketers found that 62.9% prioritized revenue, conversion rate, and pipeline, while only 31.8% connected organic-growth reporting to value metrics. The same research reported that teams can misclassify demand influenced by large-language-model answers as direct traffic.
Buyer trust adds another wrinkle. Gartner research cited there found that 53% of consumers lacked trust in AI-powered search results, and three in five wanted the option to turn AI summaries off. Some visitors will arrive informed by an AI answer, others will avoid that route, and your session report may label both groups in the same bland way.
If you need a primer before choosing a model, start with what attribution modeling means. For SaaS teams with longer paths, multi-touch attribution for SaaS growth teams offers useful context on spreading credit across touches without pretending the result is exact.
Use a combination instead of searching for one perfect model. Run a randomized holdout when traffic allows, track qualified outcomes rather than clicks alone, and ask buyers a short post-conversion question about what influenced them. Then compare short-term conversion with refund, activation, attendance, or retention rates. If signups rise but activation falls, you may have made the promise louder without making the fit better.
Remove Friction Before Visitors Convert
Friction works like a narrow doorway. Each extra field, unclear error, or slow second makes the opening smaller, and some people turn away. They may still want the product. They just don't want the effort at that moment.
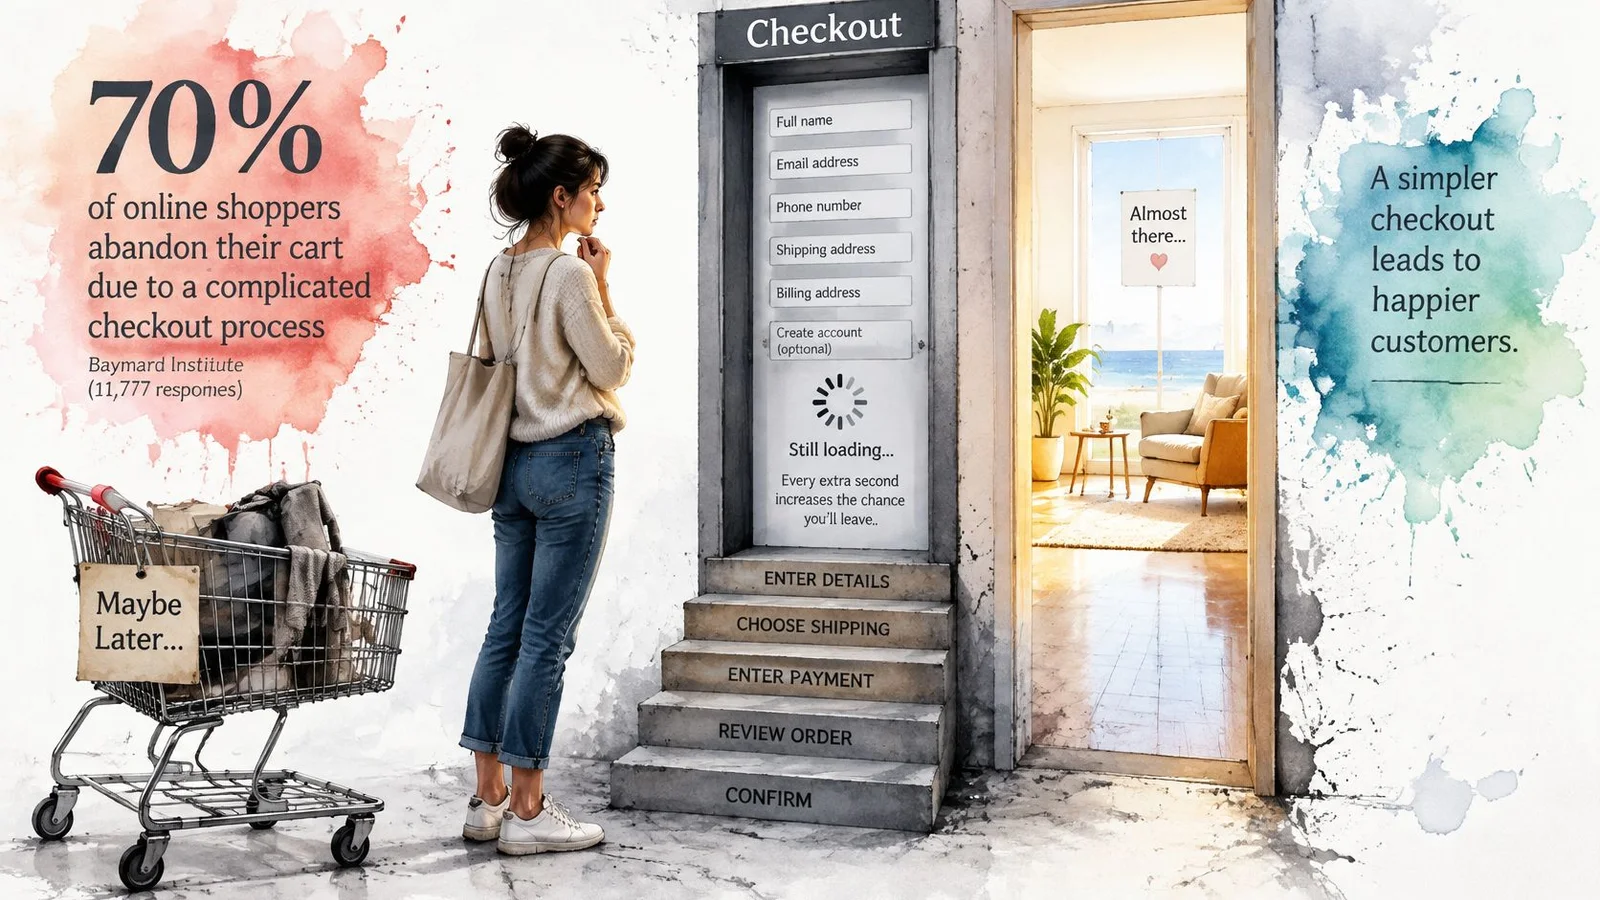
Checkout research shows how large that doorway problem can be. Baymard Institute's checkout usability research, based in part on quantitative surveys involving 11,777 participants and benchmarking across major U.S. and European ecommerce sites, estimates that the average large ecommerce site could achieve a 35.26% relative conversion-rate increase through checkout design improvements alone. Friction removal sits at the core of how to boost conversion rates and broader website conversion rate optimization.
Read that figure carefully. It's 35.26% relative, not 35.26 percentage points. If a checkout converts at 4%, a 35.26% relative increase would take it to about 5.41%, not 39.26%. That is still a meaningful gain, and the honest version is impressive enough.
The image below captures the feeling of a checkout that blocks entry instead of completing a purchase.
Count the Fields, Then Question Each One
Baymard identifies preventable drivers such as excessive form fields, unclear error handling, forced account creation, unexpected costs, and insufficient payment options. Its benchmark indicates an ideal flow can use approximately 12 to 14 form elements, whereas the average U.S. checkout displays about 23.48 by default.
You don't need to copy that ideal blindly. You do need to ask what each field earns. A phone number may help delivery updates, but it can feel intrusive for a digital course. Account creation may help repeat purchases, but forcing it before payment can stop a first order. Show fees early, explain errors beside the field that caused them, and let guests check out when the purchase doesn't require an account.
Instrument each step separately. Segment abandonment by device and traffic source, because a form that feels short on desktop can become tedious on a phone. Test field count, guest checkout, fee transparency, and payment methods one at a time where traffic allows.
Speed Decides Whether Help Gets Seen
A slow page creates friction before your message or support can do any work. In Google's mobile page speed benchmarks, as page-load time increases from 1 second to 10 seconds, the probability of a mobile visitor bouncing rises by 123%.
Measure Core Web Vitals and conversion by load-time bucket. Defer noncritical scripts, minimize JavaScript, lazy-load chat history and media, and render the primary call to action independently of enrichment features. A testimonial or chat widget can't help someone who left before it appeared. Once the page is fast enough for help to load, compare your live chat conversion rate with and without the widget rather than assuming every chat click is progress.
Finish with a fair comparison. Randomly split traffic between a lightweight page and the fully featured version, then track completed purchases or signups alongside bounce rate, interaction latency, and load time. If the richer page wins after its speed cost is counted, keep it. If it only increases chat clicks while conversions stay flat, you've added activity, not progress.
Messaging, Social Proof and Micro-Conversions
Micro-conversions are steps on a staircase. A visitor may not leap from first visit to purchase, but she might watch a lesson preview, check pricing, and reserve a seat. Each step tells you where interest grows and where people hesitate. A page with no visible steps asks for one large leap and gives you little diagnostic information when visitors refuse.
Start with message match. If someone clicked an ad promising a beginner course in spreadsheet automation, the headline should confirm that exact promise in familiar words. Lead with the outcome before the feature, such as finishing weekly reports faster, then explain the lessons or tools that make it possible. Keep one primary call to action per page so visitors don't have to decide which button matters most.
Proof Belongs Beside the Decision
Social proof works best when it's specific and close to the action.
- Named testimonials: Use a real person's role and result, such as a course graduate describing the project she completed.
- Verified counts: Show customer or student numbers only when you can support them.
- Permissioned logos: Use company logos only with permission and in the context the customer approved.
- Recent activity: Show genuine registrations or questions when the activity is real and current.
Invented numbers may produce a short burst of clicks, but they damage trust when visitors notice inconsistencies. Specific proof also helps you learn. If a testimonial about price questions sits beside the enrollment button and clicks rise, you have a clue about the objection. Our collection of 5-star review examples shows how concrete wording differs from vague praise.
Score the Small Steps Honestly
Useful micro-conversions include email capture, pricing page view, video played past halfway, calendar slot clicked, product added to cart, and webinar seat reserved. Track them as separate events with the same naming discipline you use for the main conversion. Don't add them together into one feel-good engagement score.
Assign a micro-conversion value only when it predicts the main event in your own data. For example, if visitors who view pricing later enroll at a much higher rate than visitors who don't, pricing views are a meaningful signal. If video plays rise while signups stay flat, the video may be entertaining without answering the buying question.
A micro-conversion is useful only if it predicts the main conversion. If the small step rises and the real outcome doesn't, treat it as a clue to investigate, not as a win.
For each important page, write down three things. Name the main event, choose two stepping-stone actions, and place one relevant proof element beside the call to action. That small map turns a page review into a testable plan.
Where AI Chat Widgets Lift Conversions and When to Test
A visitor reaches your pricing page at 11 p.m. and can't tell whether the course includes feedback on assignments. Without an answer, she may wait until tomorrow, compare another course, or forget entirely. An instant and accurate answer can remove that doubt while her intent is still warm.
That doesn't make AI chat automatically trustworthy. The useful question is narrower: does transparent help at the moment of doubt increase completed signups, enrollments, or registrations without weakening trust? Treat the widget as trust infrastructure that must be measured, not as decoration or pressure.
FOMOchat is one example of an AI social-proof and support chat widget grounded in site content. Every FOMOchat includes an AI company rep trained on the customer's website content, which answers visitor questions using the product details, pricing and features on the site. Conversations beat notification popups when a visitor still needs a real answer before they convert; see our take on a ProveSource alternative where conversations beat popups. You can read more about the format in our overview of the AI chat widget.
Willingness Is Higher Than Trust
In Attest's Consumer Adoption of AI Report 2025, a four-market survey of 5,000 consumers in the United States, United Kingdom, Canada, and Australia found that 54% said they were likely to engage with an AI chatbot, yet only 33% trusted companies with data collected through AI. The same source reports Ipsos found 79% agreed that companies should disclose AI use, while only 48% trusted companies using AI to keep their data safe.
That gap tells you how to design the experience. Label the bot clearly, ground answers in site content, add uncertainty qualifiers when the answer isn't firm, and offer human escalation. An undisclosed or overly realistic AI representative may increase immediate clicks while damaging enrollment quality, brand trust, or repeat purchase. A short-term conversion rate won't reveal that damage unless you also track activation, attendance, refunds, and human handoffs.
Accuracy has an operational side. Our AI learns from your website content, so site information should be kept accurate and up to date. Outdated pricing pages produce outdated answers. Before a test, review the pages the AI learns from, fix contradictions, and sample its answers to common objections. AI-generated outputs may be inaccurate or incomplete, and you're responsible for reviewing outputs before relying on them.
Know Where Not to Use It
Some pages need tighter control than an ongoing AI conversation can provide. AI Continuation is not suited to video or webinar mode, tightly controlled messaging, short visit pages such as checkout and thank you pages, or time-limited promotions with exact messaging. On those pages, a new message at the wrong second can distract from payment, contradict a timed offer, or interrupt a scripted presentation.
Testing mode matters too. Only Production mode counts visitors, and Preview mode is for testing. Use Preview to review answers and layout without polluting visitor counts. Switch to Production only when you're ready to measure real traffic.
Complex and higher priced offers need extra care. Segment results by product complexity, price, buyer age where you lawfully have it, and purchase stage. A widget that helps a first-time visitor understand course levels may annoy a returning buyer who's ready to pay. A single blended rate can hide both effects.
A Go or Wait Check for This Week
- Pick one page and name its event. Choose a pricing, course, product, or registration page, and define completion in one sentence.
- Compare with the closest benchmark row. Use the row that matches your page type and event, then record your own baseline beside it.
- Fix speed and form length first. Don't ask chat to rescue a slow page or a checkout that demands unnecessary details.
- Choose one change and state the expected lift. Write the expected absolute change, such as from 4.0% to 4.5%, before the test begins.
- Test chat only when the page can support it. The questions should be answered in current site content, and the page shouldn't be checkout, a thank-you page, a tightly timed promotion, or a controlled webinar sequence.
Run the test as a randomized holdout. Compare widget against no widget, or against a human-led version if that's your current experience. Track the named conversion first, then escalation to a human, unanswered questions, answer corrections, bounce rate, and downstream quality. Segment the result by price and purchase stage so you can see where help is valuable and where it's noise.
Start the test if you have a baseline and one clear event. Wait if you don't.
That rule protects you from the most common AI chat mistake, which is installing a tool and then hunting for a metric that improved. Decide what success means while the page is still unchanged. If the widget raises qualified signups and trust signals hold steady, expand it page by page. If it raises chats but not completions, revise the content, placement, or disclosure and test again.
Pick one pricing, course, product, or webinar page this week, set a clean baseline, and test whether instant answers plus visible social proof move visitors to sign up, enroll, or register. On a webinar replay or pricing page, FOMOchat can answer agenda and pricing questions in conversation instead of stacking another popup. FOMOchat gives you an AI company representative trained on your site content and interactive conversations you can review before going live, so you can measure the lift instead of guessing. For the improvement loop after you have a baseline, see how to improve conversion rate optimization.