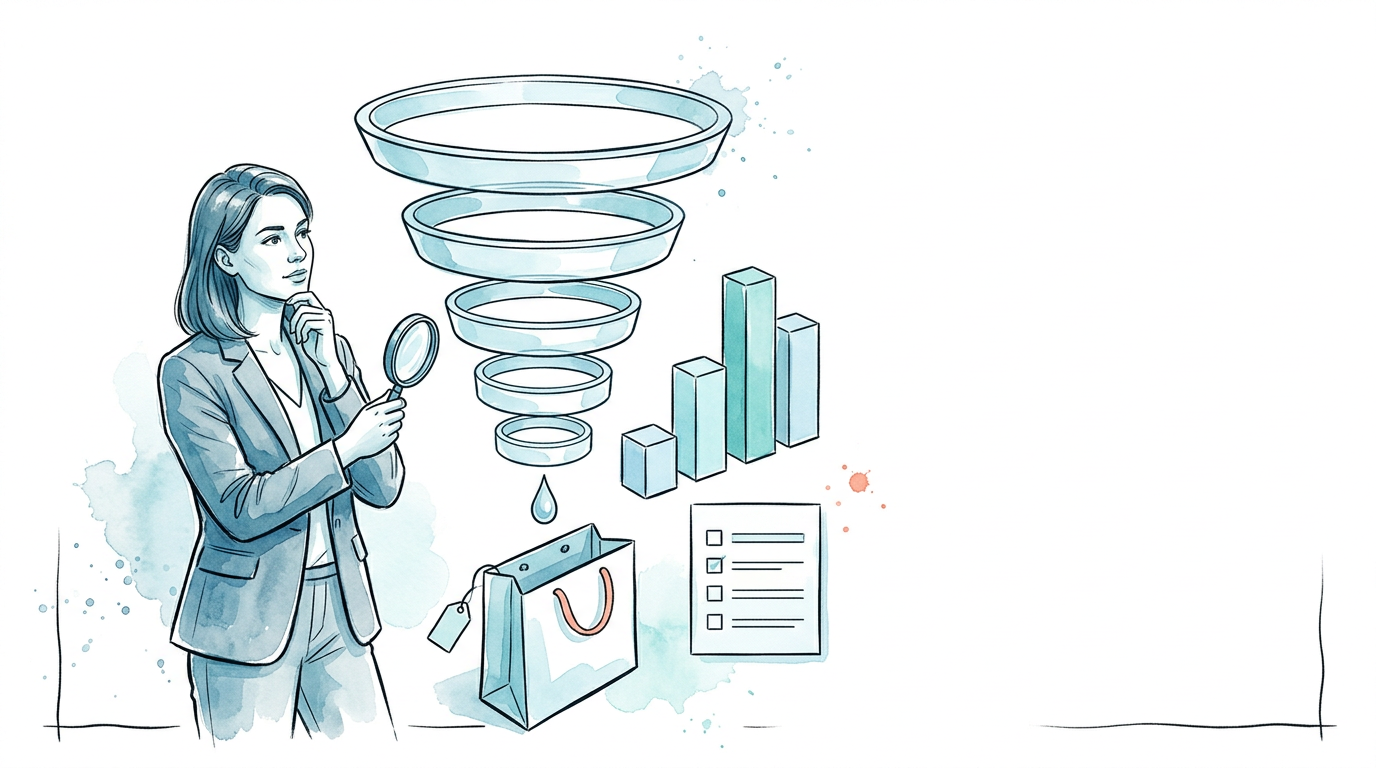
You've probably seen this before: a visitor reaches a product page, clicks the main call to action, starts a form or checkout, and then disappears. The final conversion rate looks disappointing, so the first instinct is to buy more traffic. But the visitor had already shown intent. Traffic isn't the whole story. The bigger problem may be hiding between interest and payment.
Funnel conversion rates help you find that hidden loss. They show how many people move from one defined stage to the next, whether that means visiting a pricing page, starting a registration, completing a form, or paying for an offer. Once you measure each handoff, “low conversion” stops being a vague diagnosis and becomes a practical investigation.
Why Funnel Conversion Rates Matter Beyond the Final Sale
A final purchase rate compresses an entire customer journey into one number. That makes reporting convenient, but it hides the detail you need. A visitor may understand the offer, click the CTA, begin checkout, hesitate at a required field, and leave. Treating that person as merely “not converted” hides the exact moment where the business lost qualified intent.
A funnel gives each stage a name. A SaaS journey might run from product page visit to demo request, sales qualification, opportunity, and closed customer. A course funnel may move from landing-page visit to video engagement, checkout start, and enrollment. A webinar funnel may track registration-page visit, form start, completed registration, attendance, and follow-up action.
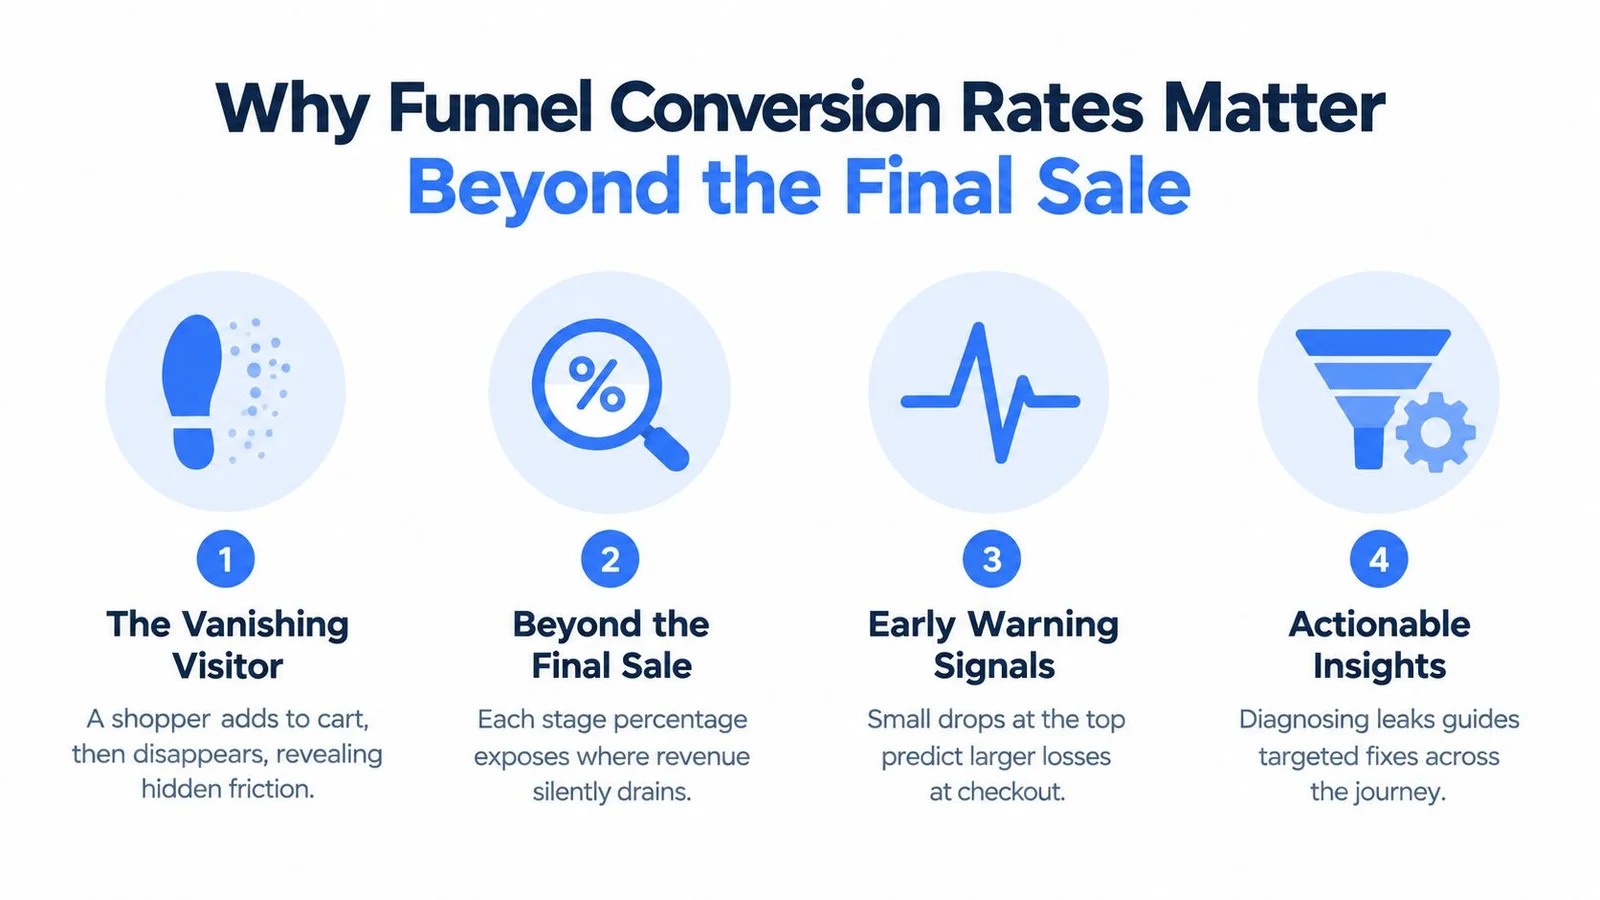
The final rate hides the location of the leak
Suppose two funnels produce the same number of customers. In one, visitors rarely click the CTA. In the other, many visitors click, but most abandon during payment. Those situations need completely different fixes. The first may require clearer positioning or a stronger offer. The second may need simpler forms, better reassurance, or a more reliable checkout experience.
That's why a funnel should be read as a sequence of conditional rates rather than one blended result:
- Interest to action: Did the visitor click, register, or begin a form?
- Action to completion: Did the person finish the form or checkout?
- Completion to value: Did the lead activate, attend, enroll, or become revenue?
- Value to retention: Did the customer continue using or buying?
Practical rule: Optimize the stage with the largest meaningful loss, not automatically the stage with the most traffic.
A useful primer on the stages and handoffs is this explanation of a conversion funnel. The central idea is simple: every stage answers a different question, and each answer points to a different action. For SaaS teams, our playbook on SaaS conversion rate optimization shows how those handoffs look on product and pricing pages.
The Math Behind Funnel Conversion Rates
The calculation is straightforward. For any stage, divide the number of people who complete the desired action by the number who entered that stage, then multiply by 100.
Stage conversion rate = completed actions ÷ stage entrants × 100
If 100 people visit a pricing page and 5 start checkout, the pricing-page-to-checkout rate is 5%. If 5 people start checkout and 3 complete payment, the checkout-completion rate is 60%. The second figure can be strong even when the first needs attention, which is why stage definitions matter.
Calculate each handoff separately
Start by writing the funnel as a line of events:
- Product view: Count the visitors or sessions that viewed the relevant product page.
- CTA click: Count the people who activated the primary action.
- Checkout start: Count those who reached the payment or registration flow.
- Completion: Count successful purchases, signups, enrollments, or registrations.
- Downstream value: Count activation, attendance, paid conversion, or qualified pipeline when that outcome matters.
For each line, use the previous stage as the denominator. Don't divide completed purchases by all website visitors when you're trying to diagnose checkout. Wrong denominator, wrong diagnosis. That produces an overall rate, not a checkout rate.
You also need to choose between visitors and visits. Unique visitors suit actions that generally happen once, such as account creation. Visits can be useful when someone may convert during multiple sessions, such as ecommerce research and purchase journeys. Keep the numerator and denominator consistent, and document the rule so reporting remains comparable.
Why benchmark context needs care
A benchmark can help you ask better questions, but it shouldn't replace your own funnel definition. For a practical framework around scaling B2B marketing benchmarks, compare stage names, audience definitions, and business goals before comparing percentages.
The phrase “conversion rate” can refer to different things. A page rate, a checkout rate, a visitor rate, and a customer rate answer different questions. This guide to CVR in digital marketing provides useful terminology, but your analytics setup still needs explicit event names and denominators.
Real-World Benchmarks Across Industries
A SaaS visitor who requests a demo and a consumer shopper who completes a familiar purchase are moving through different funnels. Their sales cycles, prices, decision-makers, traffic sources, and conversion events change what a percentage means. A “good” rate therefore needs context before it becomes a target.
Available benchmark data shows that variation. One 2025 B2B SaaS dataset reports visitor-to-lead rates from 0.7% for paid search to 2.2% for LinkedIn and 2.1% for SEO. Its MQL-to-SQL rates range from 26% for PPC to 51% for SEO (benchmark source). Treat these figures as reference points, not universal goals. The channel and funnel stage must remain attached to every rate.
Compare like with like
Before judging performance, record five details:
| Comparison detail | Why it changes the interpretation |
|---|---|
| Business model | Product-led SaaS, sales-led SaaS, ecommerce, courses, and webinars measure different actions |
| Traffic source | Paid social, paid search, SEO, referrals, and direct traffic indicate different intent levels |
| Denominator | Visitors, sessions, leads, and qualified accounts produce different rates |
| Funnel stage | A CTA click measures a different outcome from a completed payment |
| Customer value | One high-value sale may matter more than many low-intent leads |
A visitor-to-customer rate can also hide the point where intent disappears. One 2025 dataset reports an overall visitor-to-customer median of 0.10% and a top-quartile result of 0.32% (benchmark source). Those figures do not prescribe a target for every business. They show how modest losses at several stages can leave a small final result, especially between checkout start and payment.
Use benchmarks as diagnostic prompts
For ecommerce, compare product views with cart additions, cart users with checkout starts, and checkout starts with completed payments. For B2B SaaS, separate visitor-to-lead performance from qualification and sales progression. For courses and webinars, distinguish registration, attendance, and paid action.
For practical guidance on interpreting a target, see this guide to what makes a good conversion rate. Then compare cohorts within your own data, such as new and returning visitors, organic and paid traffic, and product pages and campaign landing pages. A benchmark gives you a measuring stick. Your stage-by-stage data shows where to place it. If landing pages are your weak link, our landing page conversion rate benchmark and guide to conversion rate optimization for landing pages are useful companions.
Common Causes of Funnel Leakage
A shopper can arrive ready to buy, add an item to a cart, and still disappear before payment. Each action narrows the funnel, so a checkout exit signals a different problem from a weak landing-page visit. Tracking the final sale alone hides these high-intent losses.

Baymard Institute's analysis of 50 studies reports an average global cart-abandonment rate of 70.22%, leaving about 29.78% of carts to produce an order (Baymard's cart-abandonment research). An earlier benchmark based on 13 years of tracking placed abandonment at 70.19%. The figures point to a persistent checkout problem rather than a temporary fluctuation.
Checkout friction is often a design problem
Baymard's US shopper research found that 17% of respondents abandoned an order because the checkout process was too long or complicated (Baymard checkout abandonment data). Its benchmark found an average US checkout displayed 23.48 form elements by default. Usability testing indicated that an optimized flow could be as short as 12 to 14 total elements, including 7 to 8 actual form fields.
Each extra field adds another pause, much like placing another door between a shopper and the cashier. Required account creation, unclear error messages, unexpected shipping information, and missing payment explanations can turn purchase intent into hesitation. A discount may hide the symptom while leaving the difficult path unchanged. Shortening the route and reducing decisions often addresses the underlying leak.
Abandonment also has different causes. 42% of US respondents said they left a cart because they were “just browsing” or were not ready to buy, while 17% cited a checkout that was too long or complicated. The distinction helps teams separate natural hesitation from friction they can fix through design (Baymard's checkout findings).
Trust gaps appear at the commitment point
A visitor may understand the offer and still pause when asked for payment details, a plan choice, or a longer commitment. Missing security information, vague refund terms, unanswered objections, and irrelevant proof increase perceived risk precisely when the decision becomes concrete.
For practical layout and trust guidance, use the guide from ContentBuck. Put reassurance beside the decision rather than burying it in a footer. Someone comparing plans needs billing, access, and refund answers before leaving the page.
Use the following video to examine how friction can surface across the customer journey:
Proven Tactics to Optimize Your Funnel
The strongest optimization plan connects each tactic to a specific leak. Don't add a chat widget because engagement sounds useful. Add assistance where visitors hesitate, then measure whether the targeted downstream stage improves. Our guide on how to improve conversion rate optimization walks through that prioritization.
Reduce the number of decisions
Start with the interface. Remove fields that aren't necessary for the immediate conversion, explain why sensitive information is requested, and let people see the next step before they commit. On a webinar registration page, ask only for information needed to register or qualify the attendee. On a course checkout, make price, access, refund terms, and payment options easy to find.
Improve the message before adding more persuasion. A clear CTA should tell visitors what happens next, while supporting copy should answer the objections that block that action. If analytics shows many CTA clicks but few form completions, focus on the form and the surrounding reassurance rather than rewriting the acquisition campaign.
Match proof to the objection
Social proof works best when it answers a real question. A SaaS buyer may need evidence about integrations or implementation. A course buyer may want to know what happens after enrollment. A webinar registrant may need confidence that the session will address a specific problem. Toast-style purchase alerts often miss that nuance, which is why we wrote about why social proof notifications don't work for complex products. FOMOchat takes the opposite approach: conversations that can answer the objection, not just announce a sale.
Place proof close to the relevant decision:
- Pricing concern: Explain what the plan includes and how billing works.
- Capability concern: Show a relevant use case or product detail.
- Risk concern: Make refund, privacy, and support information visible.
- Timing concern: Clarify access, schedule, or next steps.
FOMOchat is one option for this kind of intervention. It combines an AI company representative trained on website content with interactive group conversations, so visitors can ask questions and see relevant discussion around an offer. Teams can configure facts, guardrails, confidence qualifiers, branding, and placement, then evaluate conversation exposure against downstream actions rather than treating chat opens as the goal.
Test the fix against the leak
A form reduction test should use form completion as its primary outcome. A proof test should examine the stage where uncertainty is expected to matter. A page-speed improvement should be evaluated against the relevant action, not only engagement.
For more ideas on CartBoss sales growth advice, focus on prioritization rather than collecting a long list of isolated tactics. Change one meaningful variable at a time where possible, and monitor guardrails such as refunds, support escalations, payment errors, lead quality, and retention.
Instrumentation and Reporting Best Practices
Reliable reporting begins with event definitions that match real movement through the funnel. Name events such as pricing_viewed, cta_clicked, checkout_started, payment_submitted, and purchase_completed. Store useful context with each event, including device, acquisition source, new or returning status, page, plan, and exposure to a conversation when relevant.
A single overall conversion rate hides where intent disappears. Report the conditional rate at every handoff and the number of people lost there. For example, a modest fall at a high-volume checkout stage can represent more missed opportunities than a sharper decline among a small later cohort. Checkout deserves its own view because payment errors, unclear costs, and extra form fields can leak high-value intent after a visitor has already decided to buy.
Measure incremental impact
An assisted conversion shows that an interaction came before a purchase. It does not show that the interaction caused it. A visitor might open FOMOchat, read social proof, and complete payment because they were already ready. Use a randomized holdout or another consistent comparison design to test whether the experience adds value.
Set the primary outcome before examining results. Depending on the funnel, that outcome could be completed checkout, activation, attendance, paid enrollment, qualified pipeline, retention, or another downstream result. Track novelty effects, repeat visitors, bots, anonymous and logged-in users, refund requests, and support burden as guardrails.
Measurement principle: More clicks and conversations matter only when they improve the business outcome connected to the stage being optimized.
Privacy changes shape the evidence available to your team. Collect only the information you need, document consent, and separate observed data from assumptions. Consent-based and zero-party inputs can supplement behavioral events, but they should not be treated as proof that tracking is more accurate without validation.
For implementation details, use this guide to conversion tracking to align events, attribution, and reporting. Keep definitions consistent across test and control groups. Report assisted and last-click conversions separately, and do not describe either measure as causal lift without a comparison design.
Your Action Plan for Better Conversion Rates
Start with a one-page funnel map. Write every meaningful stage from entry to revenue, then define the event and denominator for each transition. If your funnel includes product views, CTA clicks, checkout starts, and payments, report all four instead of publishing only the final purchase rate.
Next, segment the results. Compare acquisition sources, device types, new and returning visitors, and the page or offer that brought people into the funnel. A weak average may hide a strong organic cohort and a weak paid-social cohort, or a mobile checkout problem masked by desktop performance.
Then prioritize one leak. Choose the stage where lost intent and potential business value overlap. If many people start checkout but fail to finish, inspect form length, errors, payment options, trust information, and unexpected costs. If visitors rarely activate the CTA, revisit the promise, proof, page hierarchy, and audience relevance. For concrete page patterns, see our examples of landing pages that convert and tactics to increase landing page conversions.
Run one controlled change and define the success metric before launch. Keep a holdout when possible, watch downstream quality, and record what happened. Repeat the cycle only after you understand whether the change improved completion, qualified outcomes, or long-term value.
FOMOchat offers an AI representative and interactive social-proof conversations that answer visitor questions on product, course, launch, and webinar pages. Use it as a measured treatment at a high-friction stage, then visit FOMOchat to explore how it can support your funnel conversion work.