
You’ve probably heard the number before: the average ecommerce conversion rate is somewhere around 2-3%. But if you’re managing your store based on that single figure, you’re missing the bigger picture.
What Is a Good Ecommerce Conversion Rate Today?
Frankly, that 2-3% average is just a starting point. A truly “good” conversion rate isn't a universal number. It's a target that shifts based on who you are, what you sell, and where your customers find you.
For every 100 visitors who land on your site, your conversion rate is simply the number of people who end up buying something.
But relying on a single industry average is like comparing a high-end furniture store to a fast-fashion brand. One might celebrate a 1% conversion rate on big-ticket items, while the other aims for 4% or more on trendy, lower-priced goods. Their goals, customers, and sales cycles are worlds apart, and the same logic applies to your online store.
Before getting too hung up on benchmarks, it’s helpful to have a solid grasp of what is conversion rate in marketing specifically for direct-to-consumer brands.
Why Context Is Everything
A "good" rate is really a reflection of how well your store is performing within its own unique environment. To set realistic goals, you first have to understand the variables that shape your performance.
Here are the big ones:
- Industry and Product Type: Selling niche hobby supplies is a totally different ballgame than selling everyday cosmetics.
- Traffic Source: A shopper clicking from a targeted Google Ad is usually much closer to buying than someone who stumbles upon your site from a viral TikTok video.
- Device: People still tend to complete purchases on a desktop more often than on mobile, where they might just be browsing or doing initial research.
- The Customer Journey: The specific path a shopper takes, from first click to final purchase, is often called a conversion funnel. Understanding their journey tells you a lot about their intent to buy.
A strong conversion rate is more than just a metric. It’s proof that your marketing, website experience, and products are all working together to meet your customers' needs. It shows you’re not just getting traffic. You're getting the right traffic.
To give you a starting reference, the table below breaks down some key benchmarks for 2026.
2026 Average Ecommerce Conversion Rates at a Glance
This table provides a quick summary of benchmark conversion rates across different segments to give you an initial reference point.
| Segment | Average Conversion Rate (%) |
|---|---|
| Overall Ecommerce Average | 2.58% |
| Desktop | 3.90% |
| Mobile | 2.20% |
| Paid Search Traffic | 2.90% |
| Organic Search Traffic | 2.80% |
| Email Marketing Traffic | 4.70% |
| Social Media Traffic | 1.10% |
Use these numbers to get a general idea of where you stand, but remember your store's context is what truly matters. We'll dig deeper into what drives these numbers next.
How to Confidently Calculate Your Conversion Rate
Alright, let's move past the industry averages and get down to what really matters: your store's numbers. Figuring out your conversion rate isn't some dark art reserved for data scientists. It's actually pretty simple once you know the formula.
This is the key to turning your traffic and sales data into a real, tangible metric you can improve.
(Total Number of Conversions / Total Number of Visitors) x 100 = Conversion Rate (%)
That's it. This one calculation gives you a powerful baseline to measure your store’s health and the success of your marketing efforts.
Finding Your Numbers
So, where do you find the "conversions" and "visitors" to plug into this formula? Thankfully, you don't have to look far. Your ecommerce platform, whether it’s Shopify or another, and your analytics tool like Google Analytics 4, have all this data waiting for you.
The trick is to be consistent. To get a truly accurate number, let's clarify two terms you’ll see all the time:
- Visitors vs. Sessions: A "visitor" (or "user") is one unique person who lands on your site. A "session" is simply a visit. The same person can come back multiple times, creating multiple sessions. For the most honest conversion rate, always use visitors, which tells you how many people you're converting, not just how many visits ended in a sale.
- Defining a 'Conversion': For most online stores, a conversion is a sale. Plain and simple. But it doesn't have to be. A conversion can be any action you want a visitor to take, like signing up for your email list or creating an account. Decide what your main goal is, but for ecommerce, that's almost always a completed purchase.
A Real-World Calculation Example
Let’s walk through a quick example. Imagine you run an online clothing store, and last month’s numbers looked like this:
- Total Visitors: 15,000
- Total Purchases: 300
Now, we'll plug those figures right into our formula:
(300 Purchases / 15,000 Visitors) x 100 = 2%
Boom. Your store’s conversion rate for the month was 2%.
Now you have a benchmark. This isn't just a random number; it's your starting line. From here, you can track it every month and see if your strategies to increase website conversion rates are actually working. With this baseline established, you're ready to start making changes that push that number higher.
Understanding the Benchmarks That Actually Matter
Knowing the general average conversion rate for ecommerce is a popular talking point, but honestly, it's mostly a vanity metric. That single number is far too broad to tell you anything useful about your own store's performance.
It’s like knowing the average temperature for the entire United States; that data won't help you decide whether to wear a coat or shorts in your city today. To set goals that actually move the needle and spot real opportunities for growth, you have to dig deeper into the benchmarks that matter for you.
A shopper's decision to buy is shaped by a ton of context: what they're buying, how they found your store, and what device they're holding. By looking at your performance through these different lenses, you can turn a vague average into a sharp strategic tool that shows you exactly where you're excelling and where you need to focus your efforts.
How Conversion Rates Vary by Industry
The biggest factor that sets the stage for your conversion rate is your industry. The price of your products, how much thought goes into a purchase, and how often customers come back all create wildly different shopping behaviors.
Just think about the mindset of the shopper. Someone buying a $15 t-shirt is making a quick, low-risk decision that’s easy to pull the trigger on. But someone shopping for a $2,500 sofa? They're going to take their time, do a lot more research, and compare their options carefully before they feel confident enough to buy.
This fundamental difference in the buying process is why benchmarks vary so much from one industry to another:
- Arts and Crafts: These products are often unique and fueled by passion, which helps them see fantastic conversion rates, often climbing above 4%.
- Food and Beverage: These are consumable goods that people buy again and again, leading to solid average conversions around 3.5%.
- Health and Beauty: This sector thrives on brand loyalty and repeat purchases, helping it achieve rates of 3% or more.
- Luxury Goods: High-price-tag items naturally involve a much longer decision-making process, so conversion rates tend to hover at 1% or even less.
The takeaway here is simple: stop comparing your store to the overall ecommerce average. Your real competition is in your specific niche.
The goal isn’t to hit some universal "good" number. It’s to outperform the average for your specific market by understanding your customer's unique buying journey.
Why Traffic Source Defines Buyer Intent
Okay, so industry sets the baseline. But not all website visitors are created equal. Where your traffic comes from tells you a story about a visitor's mindset and how ready they are to make a purchase.
Think about it: someone who clicked a link in a promotional email is in a completely different headspace than someone who was just scrolling through Instagram. Likewise, a person who Googled "buy red running shoes size 10" has a much clearer goal than someone who just landed on your blog from a friend's recommendation.
Here’s how this plays out across common traffic sources:
- Email Marketing: Traffic from your email list is pure gold. These are warm leads who already know and like your brand, which is why this channel often boasts the highest conversion rates, with averages hitting 4.7%.
- Paid and Organic Search: When someone comes from a search engine, they have a problem or a need. They're actively looking for something, which means they have high intent. This leads to strong conversion rates, typically between 2.8% and 2.9%.
- Social Media: Traffic from platforms like Instagram or TikTok is often about discovery and entertainment. People are browsing, not actively shopping, which explains the much lower average conversion rate of around 1.1%.
When you analyze your conversion rates by channel, you can start making smarter decisions about your marketing budget and double down on what’s actually bringing you paying customers.
The Great Divide Between Desktop and Mobile
Finally, let's talk about the device. For years, we've seen the same pattern: people browse on mobile but buy on desktop. This trend is all about user experience and state of mind.
Shopping on a desktop feels like a focused activity. You have a big screen, a reliable internet connection, and fewer distractions. It's a "lean-in" experience where you're ready to get down to business.
Mobile, on the other hand, is the king of "on-the-go" browsing. You might be on the train, waiting in line for coffee, or just scrolling on the couch. It’s fantastic for discovery and initial research, but the smaller screen, clumsy checkout forms, and potential for a spotty connection can create just enough friction to make someone say, "I'll do this later."
The result is a clear gap in performance, with desktop conversion rates at 3.9% consistently beating mobile's 2.2%.
Putting It All Together for Your Store
Now, let's connect all these dots. Looking at these segmented benchmarks gives you a much clearer, more realistic picture of your store’s health. Below is a table that breaks down these crucial statistics, giving you a detailed look at conversion rates across different segments. Use it to find out how you stack up against your specific corner of the market.
Average Ecommerce Conversion Rates by Industry, Channel, and Device (2024)
A detailed breakdown of conversion rate statistics across different business segments to help you benchmark your performance accurately.
| Category | Segment | Average Conversion Rate (%) |
|---|---|---|
| Industry | Arts & Crafts | 4.1% |
| Food & Beverage | 3.5% | |
| Fashion & Apparel | 2.4% | |
| Home Goods & Furniture | 1.9% | |
| Electronics & High-Tech | 1.6% | |
| Traffic Source | Email Marketing | 4.7% |
| Paid Search | 2.9% | |
| Organic Search | 2.8% | |
| Referral | 2.1% | |
| Social Media | 1.1% | |
| Device | Desktop | 3.9% |
| Tablet | 3.5% | |
| Mobile | 2.2% |
So, instead of chasing a generic 2.5% overall rate, you can now set specific and much more powerful goals. For example, you might aim to lift your mobile conversion rate from 1.5% to 2% or figure out how to get your social media campaigns to attract shoppers with higher intent. This is what real conversion rate optimization looks like. It's nuanced, targeted, and the first step toward making a meaningful impact on your bottom line.
The Hidden Factors Driving Down Your Sales
Knowing the average conversion rate is one thing, but figuring out why your own store is underperforming is a completely different challenge. When visitors land on your site and leave without buying, it’s rarely because of one big, obvious problem. It's usually death by a thousand cuts: a series of small frustrations that add up and push them away.
These "hidden" issues chip away at the trust a shopper needs to feel before pulling out their credit card. Finding and fixing them is how you turn more browsers into buyers. Let's dig into the most common culprits that kill conversions.
Confusing or Difficult Site Navigation
Shoppers show up with a mission. If they can't figure out how to find what they're looking for right away, you've lost them. A messy menu, a useless search bar, or an illogical site layout is like dropping them in a maze without a map.
if you walked into a real-world store and couldn't find the right aisle or an employee to help, you wouldn't wander around for an hour. You'd leave and go somewhere else. It’s the same online. In fact, research shows 69% of online shoppers head straight for the search bar, and a bad experience there is enough to make 81% of them ditch your site for a competitor's.
This chart drives home just how much conversion rates can vary depending on where a customer comes from, what device they're on, and what industry you're in.
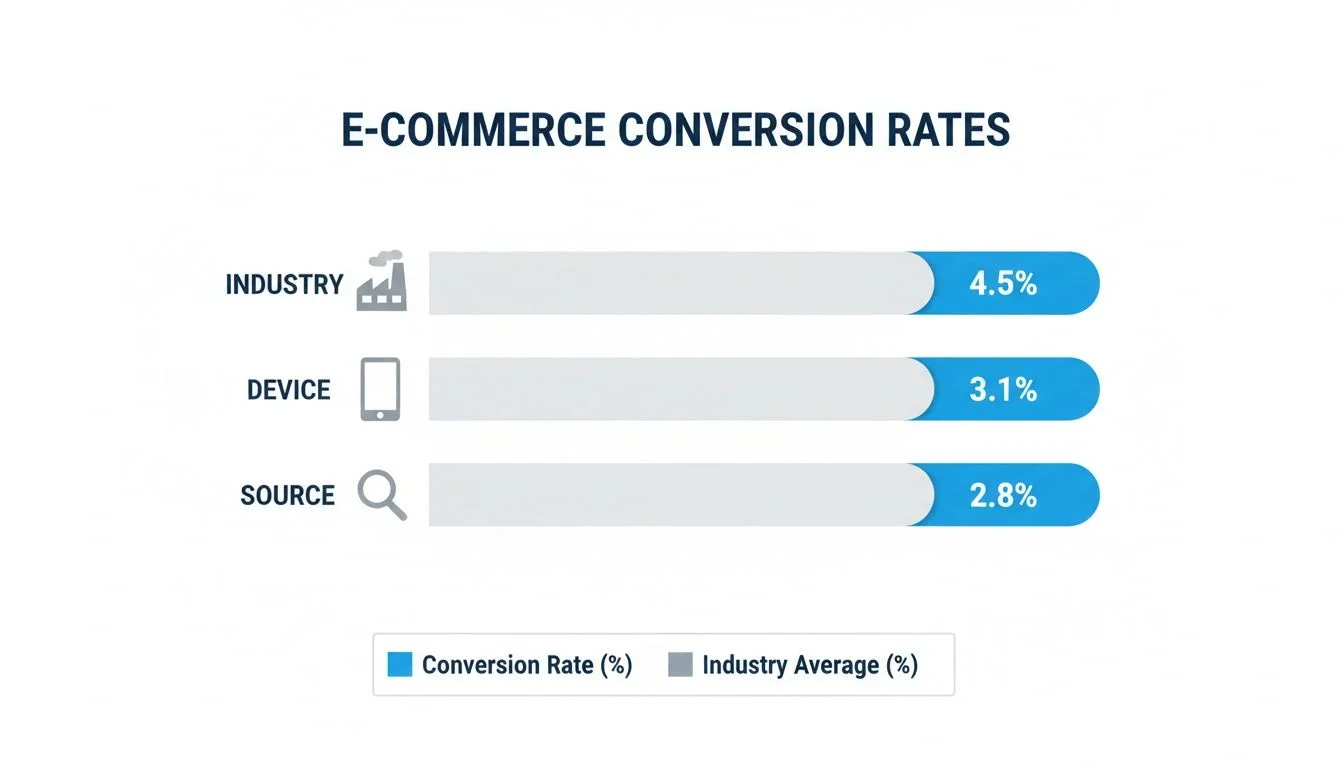
As you can see, the context of the shopper (like whether they're on mobile or came from an email link) sets a completely different baseline for what a "good" conversion rate looks like.
Slow Page Load Speeds
In ecommerce, every second counts. Literally. With each extra second your site takes to load, you give potential customers another reason to get impatient and hit the "back" button. A slow site just feels unprofessional and untrustworthy.
A one-second delay in mobile load times can impact conversion rates by up to 20%. This isn't a minor hiccup; it's a direct blow to your revenue. You're losing sales before a visitor even gets a chance to see your products.
This problem gets even worse on mobile, where people are often on the move and have zero patience for sluggish pages. If your product images take forever to appear or the checkout screen lags, you’re actively pushing your most interested buyers away at the worst possible moment.
Uninspiring Product Presentation
Your product pages are your digital storefront. If they're filled with low-quality photos, generic descriptions, or don't show the product in a real-world context, you're failing to give shoppers the confidence they need to buy.
Watch out for these common mistakes:
- Poor-Quality Images: Grainy, small, or single-angle photos hide the very details a customer is looking for.
- Lack of Lifestyle Shots: People want to imagine how a product fits into their life, not just see it floating against a plain white background.
- Vague Descriptions: Don't just list features. Explain the benefits. How does this product solve a problem or make their life better?
Great product presentation closes the gap between seeing something online and feeling like you truly understand it.
Surprise Costs and a Clunky Checkout
You've done everything right, and the customer is ready to buy. Don't lose them at the finish line. The checkout is where your most committed buyers are most likely to drop off, and the number one reason is a complete surprise: unexpected costs.
Finding out about a high shipping fee at the last second creates a jarring psychological break. The price they had accepted in their mind is suddenly wrong, which feels deceptive and frustrating. The other major deal-breaker is a long, complicated checkout that demands too much information. To dive deeper, check out our guide on how to reduce cart abandonment and protect your sales.
By tackling these hidden friction points, you can pave a much smoother path from the moment a visitor arrives to the moment they click "Complete Purchase."
Proven Strategies to Boost Your Conversion Rate
Alright, so you know what’s holding your sales back. What's next? It’s time to stop diagnosing and start acting.There's no single magic bullet for boosting your average conversion rate for ecommerce. Instead, it's about making a series of smart, targeted improvements that earn your customer's trust and make their journey from browser to buyer as smooth as possible.
Let's dig into some proven strategies you can put into practice today. These aren’t just theories; they're the practical changes that turn hesitant visitors into confident customers.
Optimize Your Site Search and Navigation
Think about it: when someone lands on your site, they’re on a mission. If they can't find what they're looking for in a few seconds, they’re gone. Your navigation menu and site search bar are their most important tools.
Your search bar should be your best salesperson. It’s shocking, but while 69% of shoppers go straight to the search bar, a study from Baymard Institute found that a staggering 72% of sites deliver a frustratingly bad search experience. Every bit of that friction costs you a sale.
To turn your search into a conversion machine, you need features that make discovery effortless:
- Smart Autocomplete: As someone types, suggest relevant products, categories, or popular search queries. This alone can lift sales by 24% by guiding shoppers right where they need to go.
- Visual Search Results: Don't just show text. Display product images in the dropdown so people get instant visual confirmation they’re on the right track.
- Allow for Typos and Synonyms: Your search needs to be smart enough to know that "sneakers" means "running shoes" and to forgive a simple spelling error. Don't make customers work for it.
Craft Compelling Product Pages
Your product page is your digital sales pitch. This is where the magic happens, where you convince a shopper that your product is the solution they've been searching for. Generic descriptions and boring photos just won't cut it anymore.
The secret is to stop listing features and start selling benefits. Instead of just saying "100% cotton," tell them what that means: "Enjoy breathable, all-day comfort with soft, 100% premium cotton." This tiny shift helps customers actually picture themselves using and loving your product.
You also have to make a powerful visual argument. High-quality, professional photos and videos aren’t a luxury; they're essential. Show your products from every angle, in different settings, and on various models if it makes sense. This helps close that mental gap between seeing something online and knowing how it will look and feel in real life. We dive deeper into this in our guide to landing page optimization best practices.
Build Trust with Social Proof and Instant Support
Online shoppers are naturally skeptical. Before they hand over their credit card information, they need to feel confident, not just in the product, but in your entire brand. Two of the best ways to build that confidence are with social proof and proactive support.
One of the most powerful forms of social proof is showing that other real people are interested in and buying your products. This is exactly where a tool like FOMOchat shines. It displays an AI-powered chat widget that showcases realistic, helpful conversations about your products, creating a bustling and trustworthy atmosphere.
When a new visitor sees questions being asked and answered, it validates their own interest and addresses their potential objections before they even have to ask. It turns a static product page into a lively, credible space where purchasing feels like a smart decision.
This creates an environment where shoppers feel informed and confident, directly tackling the hesitation that so often kills conversions.
Streamline Your Checkout Process
The checkout is the final hurdle. This is where your most valuable customers are, but it's also the easiest place to lose them. Surprise shipping costs, forcing people to create an account, and long, confusing forms are absolute conversion killers.
Your one and only goal here should be to make checking out as fast and frictionless as possible.
Here are three non-negotiable rules for a high-converting checkout:
- Be Transparent with Costs: Show every cost, including shipping and taxes, right up front. A Baymard Institute study found that 48% of shoppers ditch their carts simply because the extra costs were a nasty surprise.
- Offer a Guest Checkout: Forcing someone to create an account is a massive roadblock. Always, always provide a guest checkout option to keep the momentum going.
- Offer Diverse Payment Options: People have their favorites. By offering digital wallets like Apple Pay, Google Pay, and PayPal, you cater to their habits and make paying a one-click affair. Stripe found that businesses offering Apple Pay saw a 22% increase in conversion on average.
Once you have these basics down, you can start exploring other powerful ways to increase conversion rate on Shopify with targeted UX tweaks and in-cart rewards. Small, simple changes at this final stage can have a huge impact on your bottom line.
Your Ecommerce Conversion Rate Optimization Checklist
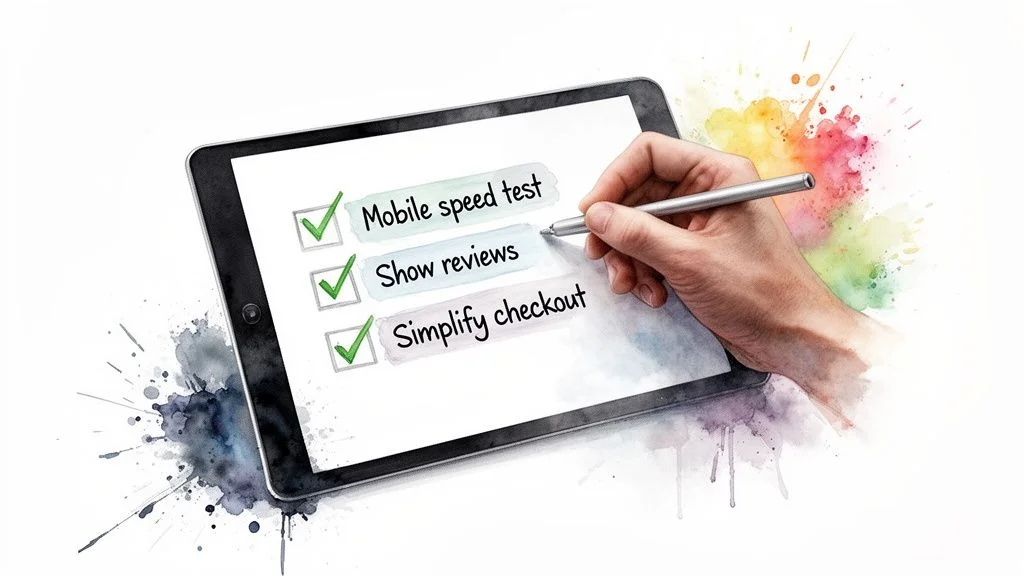
Alright, you've got the data on the average conversion rate for ecommerce. Now it's time to roll up your sleeves and put that knowledge to work. This checklist is your starting point for auditing your own store and pinpointing the biggest opportunities for real growth.
Think of it as a guided walkthrough of your customer's journey. Use these prompts to find and fix the friction points that are costing you sales, from the very first click to the final purchase.
Site Performance and User Experience
A clunky, slow website is the digital equivalent of a cluttered store with sticky floors. People will just turn around and leave. The foundation of any good conversion rate is a fast, smooth, and intuitive experience.
- Test Mobile Load Speed: Grab your top 3 landing pages and a key product page and run them through a speed test. A single one-second delay can slash mobile conversions by up to 20%. It’s that critical.
- Audit Your Site Search: Can shoppers find a product even if they make a small typo? Does your search bar suggest popular items as they type? Since a massive 69% of shoppers head straight for the search bar, a bad experience here sends them directly to a competitor.
- Check Mobile Navigation: Pull up your site on your phone right now. Is the menu a breeze to use? Can you find a major product category in just a couple of taps? If not, you're creating unnecessary work for your visitors.
Your website isn’t just a digital catalog; it’s your best salesperson. Make sure it's ready to guide, assist, and close the deal without getting in the way. A seamless experience builds the trust needed to turn a visitor into a customer.
Product Page Persuasion
This is where casual browsing turns into a serious buying decision. Your product pages have one job: to be so compelling, informative, and visually appealing that the "Add to Cart" button is the only logical next step.
- Review Product Imagery: Look at your best-selling products. Do you have crisp, high-resolution photos from every angle? Even better, are there lifestyle shots showing the product in action?
- Analyze Product Descriptions: Read your descriptions out loud. Seriously. Do they sound human? Do they focus on the benefits ("you'll enjoy breathable all-day comfort") instead of just listing features ("made of 100% cotton")?
- Confirm Pricing and Shipping Clarity: Is the price front and center? More importantly, can a shopper easily find shipping costs before they start the checkout process? Surprise fees are the number one reason for cart abandonment.
Trust and Social Proof
People are naturally wary of buying online. Before they hand over their credit card information, they need to see that your business is legitimate and that other people have had a great experience buying from you.
Here are the key trust signals to check for:
- Customer Reviews are Visible: Are reviews easy to find right on the product page? Or are they buried somewhere else on the site?
- Security Badges are Present: Do you display familiar payment logos (like Visa or PayPal) and a security seal in your footer or during checkout? These small icons provide instant reassurance.
- Social Proof is Active: Does your site feel alive and busy? A tool like FOMOchat can make a huge difference here by showing a live feed of questions and answers, creating a sense of a bustling, trustworthy community.
Checkout Flow Optimization
You’ve done all the hard work to get a customer this far. Don't lose them on the final stretch! Any confusion or extra step in the checkout process is a massive risk.
- Count the Clicks: From "Add to Cart" to "Purchase Confirmed," how many clicks does it take? Every click is a chance for someone to second-guess their purchase. Make it as short as possible.
- Verify Guest Checkout: Can someone buy from you without the hassle of creating an account? Forcing registration is a notorious conversion killer. Always offer a guest option.
- Check Payment Options: Are you offering modern payment methods like Apple Pay or PayPal? Businesses that add Apple Pay as an option see an average conversion lift of 22%. It's that much easier for shoppers.
Common Questions About Ecommerce Conversions Answered
Alright, you've seen the benchmarks, but what do those numbers really mean for your store day-to-day? Let's clear up a few common questions that pop up once you start digging into conversion rates.
Is It Better to Have a Higher Conversion Rate or More Traffic?
This is the classic "chicken or the egg" for store owners. My take? Focus on your conversion rate first.
I love the leaky bucket analogy for this one. Think of your traffic as the water you pour into the bucket, and your conversion rate as how big the leaks are. Why spend a ton of money on ads just to pour more traffic into a site that isn't turning visitors into customers?
First, plug the leaks. Get your site converting the traffic you already have. Once you've done that, every new visitor you acquire is far more valuable, and your marketing budget will deliver a much bigger punch.
How Often Should I Check My Conversion Rate?
Resist the urge to check your conversion rate every single day. Seriously. Daily numbers can jump all over the place because of a weekend dip, a random shout-out, or a small sale. Making decisions based on that daily noise is a recipe for a headache.
A much better rhythm is looking at your conversion rate weekly or monthly. This smooths out the random highs and lows, giving you a truer sense of your store's health and whether the changes you're making are actually moving the needle.
This longer-term view helps you spot real trends, not just statistical blips.
What Is a “Micro-Conversion” and Why Does It Matter?
A sale is the ultimate goal, but a "micro-conversion" is any smaller action a shopper takes that shows they're getting closer to buying. These are the little "yeses" on the journey to the big "yes."
A few examples of micro-conversions are when a visitor:
- Adds an item to their cart
- Signs up for your email list
- Creates an account on your store
- Watches a product demo video
By tracking these, you can pinpoint exactly where your customer journey is working well and where it's breaking down. If you have tons of "add to carts" but very few checkouts, you know there's a problem in your cart or checkout flow that needs fixing.
How Long Does It Take to See an Improvement in Conversion Rate?
This really depends on two things: the size of the change you're making and how much traffic your site gets. If you have a high-traffic store, a simple A/B test on a button's color could give you a clear winner in just a few days.
But for bigger overhauls, like a complete homepage redesign, you'll need more time and data to be sure. For stores with lower traffic, it might take several weeks or even a month to collect enough information. The key is to be patient and let the data tell the full story.
Ready to turn more of your curious visitors into confident buyers? FOMOchat uses AI-powered social proof to build trust and answer shopper questions in real-time, lifting your conversion rate without extra effort. Get started for free and see the difference at https://fomochat.com.