
Split testing, also called A/B testing, randomly shows version A (what you run now) and version B (one defined change) and compares a metric chosen before the test.
The popular advice is to keep the version with the higher conversion rate. That leaves out the hardest part: knowing whether the difference is evidence or ordinary noise. A useful test needs a stopping rule, and a low-traffic launch may end with a lesson rather than a winner.
What Split Testing Compares on a Live Page
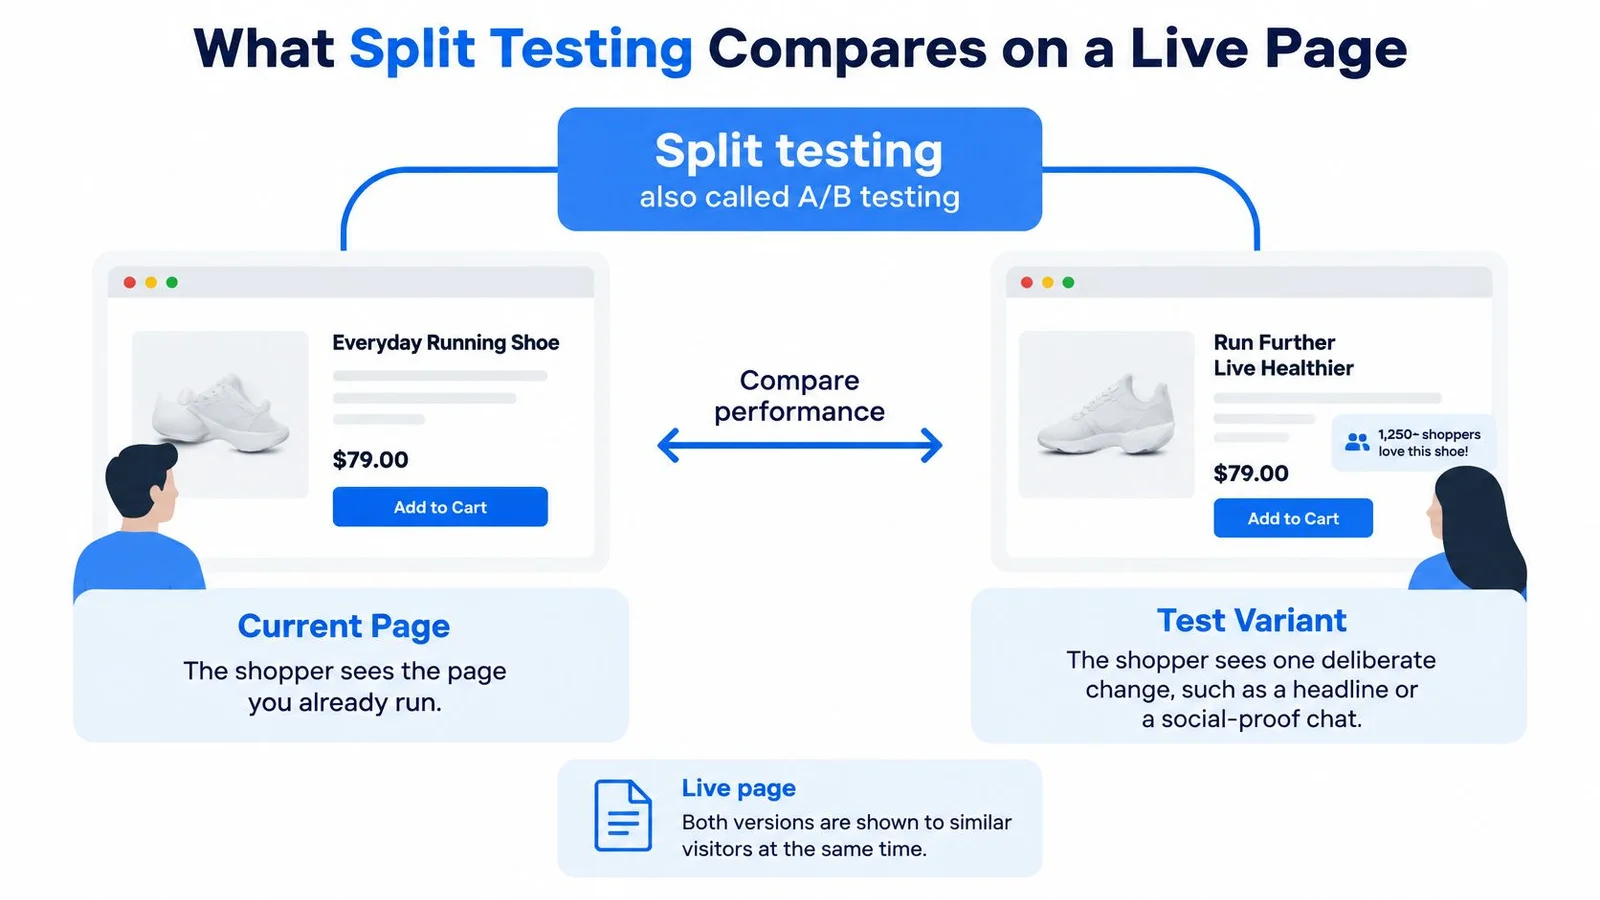
Two shoppers arrive at the same product page. One sees the page you already run; the other sees the same page with a deliberate change, such as a clearer headline or a social-proof chat. If you are still framing the bigger goal, start with what conversion rate optimization is, then come back to the single-change experiment.
Split testing is a randomized controlled experiment, not a before-and-after comparison. Version A is the control, your existing experience, and version B is the treatment, the defined change you want to evaluate.
The logic predates websites: Stanford Graduate School of Business traces its foundations to Ronald A. Fisher's 1925 book Statistical Methods for Research Workers, explaining how randomized agricultural experiments established the control-versus-treatment approach.
On a website, random assignment helps balance differences between visitors. You aren't deliberately sending loyal customers to the new page and unfamiliar prospects to the old one. Both versions run alongside each other, making the comparison less vulnerable to changes in campaigns, timing, or audience mix.
The diagram shows that shared starting point.
The five parts of a split test
| Part | What it means | Product-page example |
|---|---|---|
| Control (A) | The experience you already run | Current product page with no widget |
| Treatment (B) | One defined change only | Same page with a social-proof chat added |
| Assignment | Random split of comparable visitors | Equal allocation from the same traffic sources |
| Primary metric | One outcome chosen before launch | Signup or registration rate |
| Guardrail | A result that must not get worse | Refund rate or revenue per visitor |
The primary metric answers whether the change achieved its purpose. The guardrail checks whether you paid for that improvement somewhere else. More registrations aren't necessarily useful if those customers immediately request refunds.
One change, a random split, and one metric locked before launch.
For broader business context, Up North Media's guide to A/B testing for business growth is a useful companion. To choose a page element worth testing, use these landing-page optimization best practices to identify unclear promises, unanswered objections, and distracting actions. When you need more than two variants, see A/B/n testing, and for page-level experiments review how to test landing pages without changing too many things at once.
For the social-proof scenario, keep the experiment concrete: widget off in A, widget on in B, and registrations chosen before launch. You're measuring whether the addition helps visitors take the intended action, not whether teammates prefer the busier page.
The Sample Size and Confidence Rules
A higher percentage on a dashboard isn't a winner. It's an observation that needs enough data and a decision rule.
Before launching, record the baseline conversion rate, the minimum detectable effect, the significance level, and the desired statistical power. These inputs determine the sample your experiment needs. Choosing them after seeing results lets the outcome influence the rules used to judge it.
What the planning inputs mean
Your baseline is the current rate for the outcome you're testing, measured among visitors eligible for the experiment. Don't use a sitewide purchase rate to size a test that only includes visitors to a particular signup page.
The minimum detectable effect is the improvement you want the experiment to be capable of detecting. Start with the smallest change worth implementing, then check whether your available traffic can support that ambition. Don't select an implausibly large improvement merely to make a calculator return a comfortable sample.
Adobe's sample-size guidance uses 95% confidence, corresponding to a 0.05 significance level and roughly a 5% false-positive risk under the test assumptions, alongside 80% power, meaning an 80% probability of detecting a real effect of the planned size.
Those conventions describe the testing procedure. They don't mean a particular treatment has that probability of being the better business choice.
Planning numbers for a trustworthy split test
| Input | Common convention | What it controls |
|---|---|---|
| Significance level (alpha) | 0.05, often called 95% confidence | About a 5% false-positive risk under the test assumptions |
| Statistical power | 80% | Chance of detecting a real effect of the size you planned |
| Baseline conversion | Your current rate on the primary metric | How much ordinary noise to expect |
| Minimum detectable effect | Smallest lift worth acting on | A 1-point lift needs many more visitors than a 10-point lift |
| Primary metric | One outcome chosen before launch | Stops the team from shopping the dashboard |
| Sample or duration | Calculated before launch and then held | Stops a winner call on an early spike |
The effect-size contrast in that planning table matters. A modest signup improvement is harder to distinguish from random variation than a large improvement, so it needs more observations. There isn't a universal visitor count that makes every split test trustworthy.
Be precise about percentage points versus relative lift when entering your assumptions. A percentage-point change describes the difference between conversion rates; relative lift describes that difference in relation to the starting rate. Mixing them up changes the experiment you're planning.
Read the completed test, not just its color
For a finished test, a p-value below the preset significance level supports rejecting the null hypothesis that the offers convert equally. It doesn't tell you whether the improvement covers implementation costs or whether another audience will respond identically.
Configure your analytics dashboard to show assignment, eligible visitors, conversions, and guardrails. Check that the conversion event means the same thing in both versions, and distinguish visitors assigned to the experiment from unrelated site traffic.
For a fixed-horizon test, enough data means reaching the planned sample, with valid tracking and completed outcome measurement. A flattering day doesn't replace those requirements.
Why Stopping Early Creates False Winners
Launch day looks promising. The new variant is ahead, the dashboard turns green, and someone asks whether the team can ship before the next campaign goes out.
The temptation is understandable, especially for a SaaS release, course enrollment window, or webinar campaign. But repeatedly checking an ordinary fixed-horizon test and stopping at the first significant result gives random fluctuations more opportunities to become an apparent win.
A fixed-horizon test and a sequential test have different reading rules. The Stanford-hosted sequential-experiments guide explains methods that allow interim analysis with error control, including checkpoints based on accumulated information rather than calendar time.
Early stopping needs a design, not permission from a badge
In a fixed-horizon design, collect the planned sample before making the statistical winner call. You can still monitor whether tracking works or whether the treatment breaks the page. Operational safety checks aren't the same as repeatedly asking whether you've won.
In a preplanned sequential design, the method accounts for interim decisions. That might involve scheduled group-sequential checks or an always-valid procedure. Don't assume a tool supports this just because its results update continuously.
Set the stopping rule before the first visitor arrives, not after the treatment takes the lead.
Running until significance isn't automatically rigorous. Neither is choosing an arbitrary calendar window without checking whether it can deliver the sample and completed outcomes you need.
Stopping habits and the safer rule
| Habit | What it does | Safer rule |
|---|---|---|
| Stop at the first confidence badge | Inflates false winners on a fixed test | Wait for the planned sample unless a sequential design was set first |
| Run until it looks significant | Turns peeking into the decision | Schedule interim looks by sample collected, not by mood |
| Always use the same calendar window | Can be too short or unnecessarily long | Set a maximum sample or duration using the planned effect and traffic |
| Ship any significant lift | Ignores cost and practical size | Require the lift to clear implementation cost and a guardrail |
| Treat a flat result as nothing | Throws away directional learning | Record what moved, its uncertainty, and the sample needed to resolve it |
Write the decision conditions together: primary metric, minimum detectable effect, maximum sample, maximum duration, permitted checkpoints, and guardrail. Specify what happens if the deadline arrives before the sample does. Otherwise, a launch deadline can become an excuse to lower the evidence standard without anyone noticing.
Statistical significance also isn't an implementation order. A detectable improvement might be too small to justify maintenance, design work, or support costs. Conversely, an inconclusive result can suggest a useful next question, provided the team labels it as exploratory rather than proven.
What to Do When Traffic Is Too Low
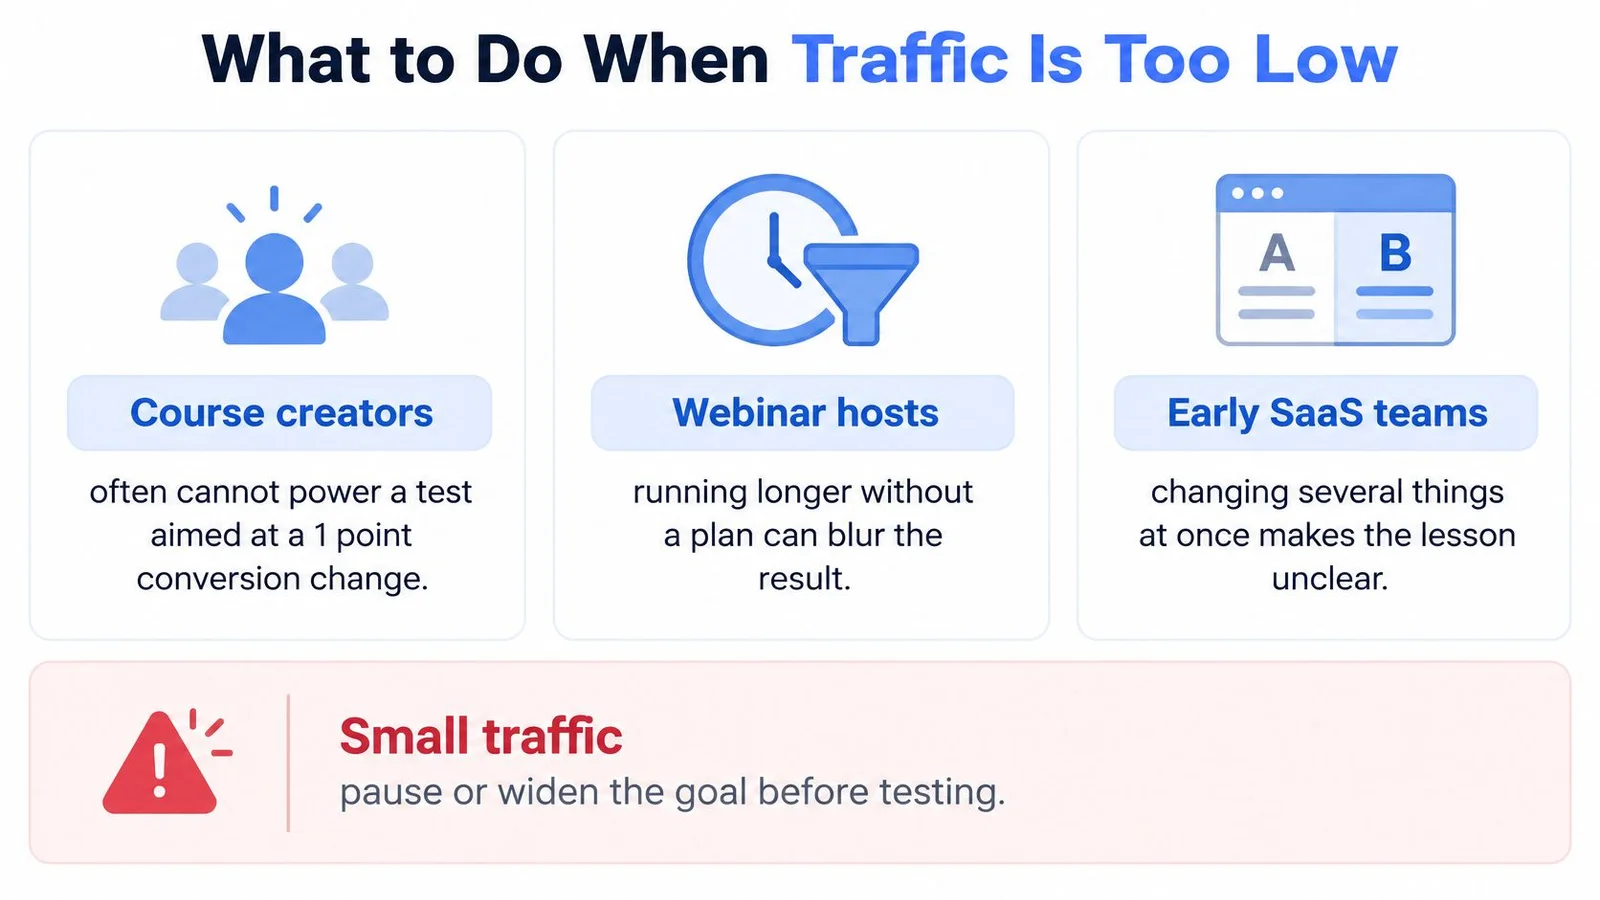
Low traffic changes the question from proving a winner to learning without overstating certainty. A course creator, webinar host, or early SaaS team may have a meaningful launch audience but still lack enough eligible visitors to resolve a modest conversion difference. On a webinar replay page, FOMOchat can answer agenda and pricing questions in conversation instead of stacking notification popups, which keeps the treatment focused on one measurable change.
Running indefinitely doesn't fix a poorly planned experiment. Nor does changing several unrelated elements and then crediting whichever one the team likes best. Start by comparing the experiment's required sample with the traffic the actual page can receive during the launch.
These options help match the question to the audience available.
Low-traffic options compared
| Option | When it fits | What it gives you | Limit |
|---|---|---|---|
| Test a larger change | Traffic is too thin for a modest lift | A detectable effect better matched to real volume | Says less about small tweaks |
| Holdout against the current page | A clear control and a short launch window | Comparison against what runs now | Still needs the planned sample for a winner call |
| Pair numbers with chat and sales objections | The same questions keep appearing | Possible explanations for visitor behavior | Qualitative evidence, not proof |
| Watch qualified signups or retained users | Clicks don't reflect customer value | An outcome closer to revenue | Slower to read and potentially sparse |
| CUPED using pre-experiment history | Suitable prior behavior is available | Reduced variance using pre-test behavior | Excludes covariates changed by treatment |
A larger change should still answer a clear question. For example, replace a vague product promise with an explicit explanation of who the product serves, rather than simultaneously changing the offer, price, navigation, and checkout.
Before choosing that question, inspect which pages and campaigns supply eligible visitors. Expressify AI's guide to website traffic analysis for small businesses provides a useful starting point for that traffic review.
Use advanced methods carefully
CUPED is a variance-reduction method that uses pre-experiment behavior as a covariate. The original CUPED paper reports that a pre-period of roughly one to two weeks often works well, but covariates affected by the treatment must be excluded because they can bias results.
That isn't a shortcut for every launch. New visitors may lack useful history, and the method needs correct implementation.
Keep qualitative observations separate from causal claims. If visitors repeatedly ask whether a course includes feedback, that gives you a hypothesis about an unanswered objection. It doesn't establish that adding an answer will increase purchases.
For a video explanation to accompany your experiment planning:
Report the estimated difference with an uncertainty range, not just the leading version. If the launch closes before the planned sample arrives, record an inconclusive result, the objections you learned about, and what the next experiment would need to resolve.
Page, Widget and Social Proof Examples
A useful treatment starts with a visitor problem. The page doesn't explain the benefit, the button doesn't describe the next step, or the visitor can't find an answer to a purchase objection.
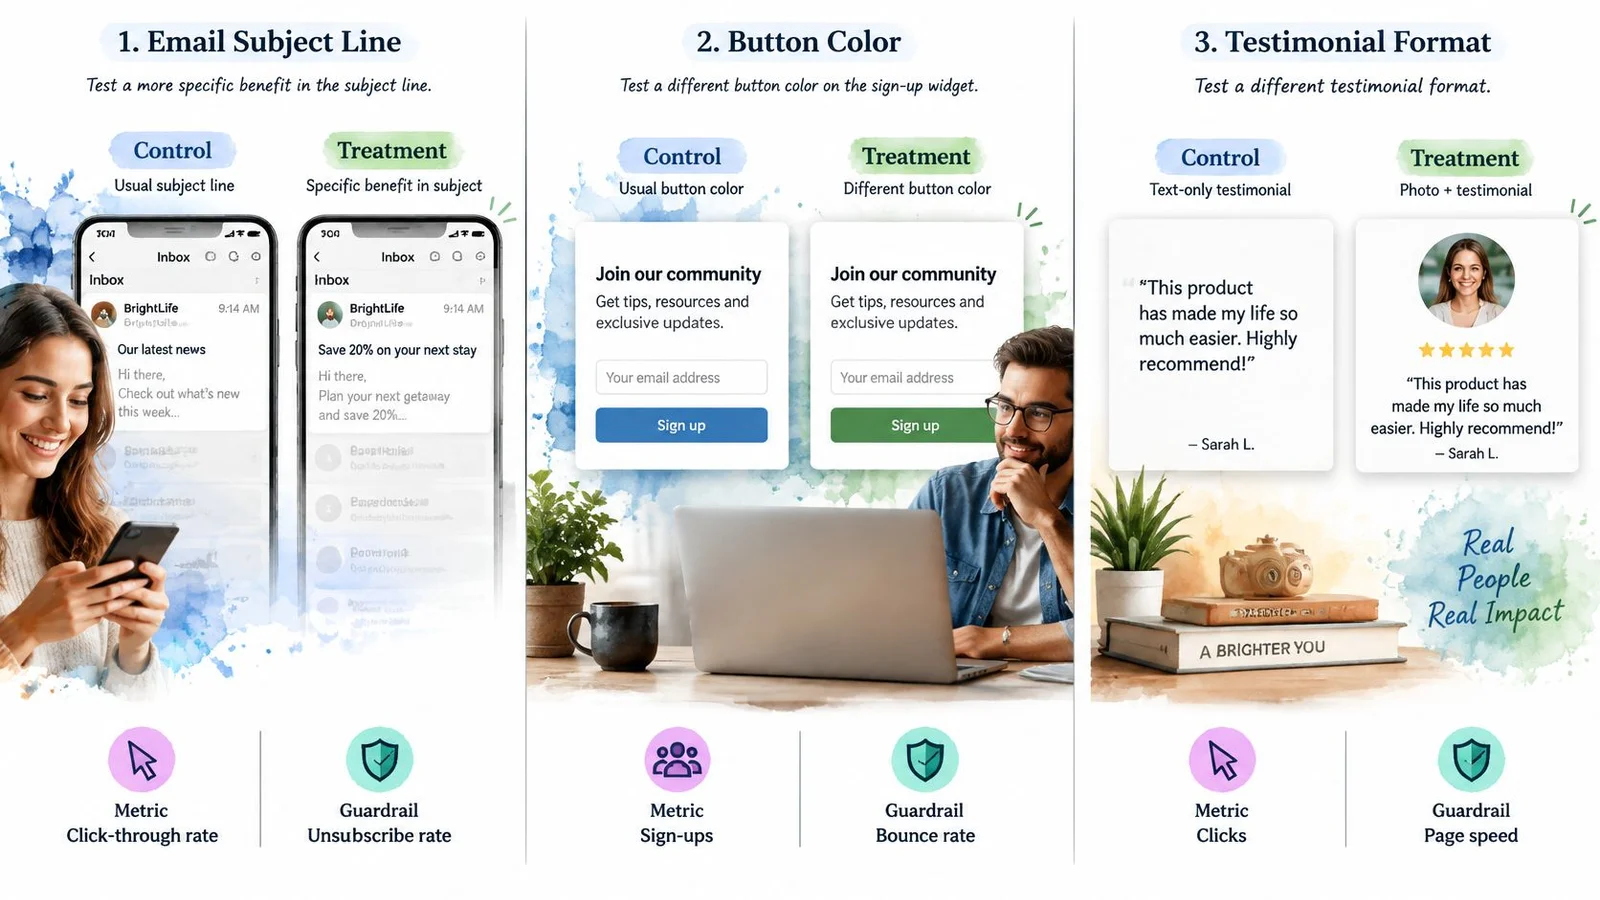
Keep the proposed fix narrow enough that the result answers a recognizable question. These examples show how the control, treatment, metric, and guardrail fit together.
Three split tests, one change each
| Example | Control (A) | Treatment (B) | Primary metric | Guardrail |
|---|---|---|---|---|
| Usual subject line | Subject line with a specific benefit | Click-through rate | Unsubscribe rate | |
| Product page | Current hero headline and button | Only the headline or primary button label changes | Signup or add-to-cart | Revenue per visitor |
| Social-proof chat | Same page with no on-page conversation | Chat showing realistic visitor questions and on-site answers | Registrations or demo requests | Bounce rate or complaint volume |
For email, say your usual subject announces a product update. The treatment names the task the update helps subscribers complete. Keep the sender, body, offer, and delivery conditions consistent so you're evaluating the subject-line change rather than a different campaign.
Measure click-through among assigned recipients, not just those who opened. Otherwise, you change the denominator based on behavior the treatment may influence.
For a product page, choose the headline or the button label, not both. A headline test might replace a broad promise with a specific use case. A button test might clarify whether clicking starts a trial or opens a sales conversation. Teams chasing signup lift often pair this with guides on how to increase landing page conversions and SaaS conversion rate optimization.
Social proof needs relevant, transparent content
For social-proof chat, ask whether answering a page-specific objection helps visitors register or request a demo. A course page might address prerequisites; a product page might address compatibility. Use these customer-review examples to think about relevant proof, while keeping genuine customer statements distinct from generated dialogue.
Our FOMOchat widget can serve as the treatment arm: it includes an AI representative trained on website content and AI-generated participants asking common questions. Treat those conversations as generated content, not evidence that real customers made those statements. For placement and UX patterns, compare a website chat widget with an interactive chatbot before you lock the treatment.
AI Continuation isn't suited to video or webinar mode, tightly controlled messaging, short-visit pages such as checkout and thank-you pages, or time-limited promotions requiring exact wording. Use controlled messaging for those situations if you test them at all.
Don't judge a chat by how active it looks. Pick the closest example and write a hypothesis connecting the specific change to the visitor's decision.
Run the Test in Order and Write the Brief
Treat the experiment like a dish going into an oven: set the timer before cooking, not when the top looks browned. Your test brief serves the same purpose. It records the conditions under which you'll make a decision before the outcome becomes tempting.
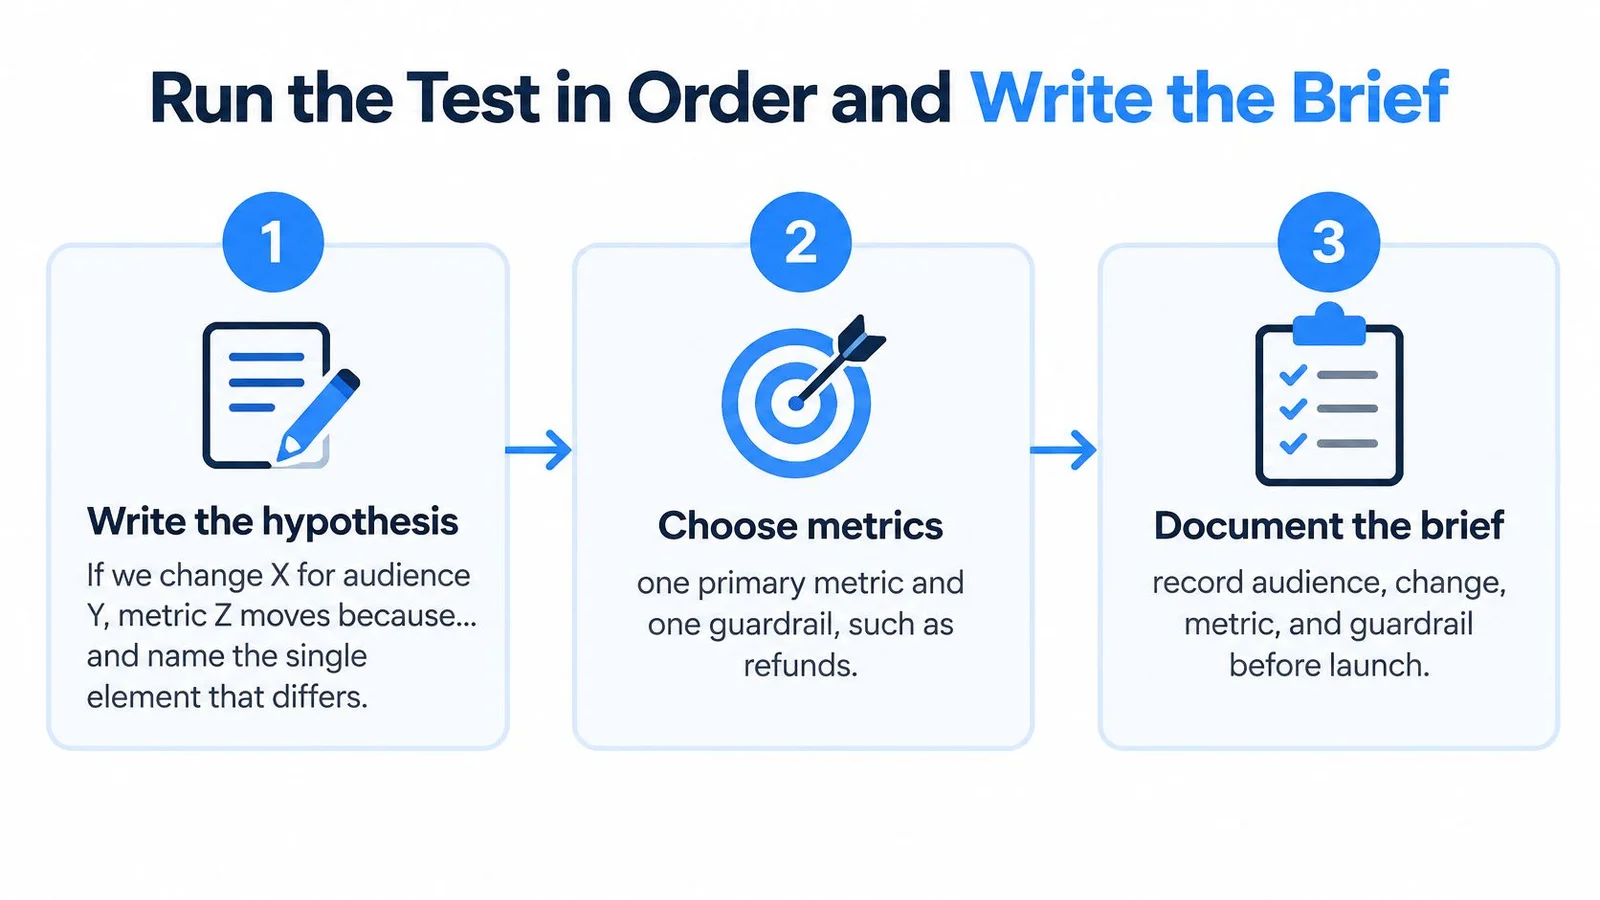
The workflow starts with a hypothesis and a documented measurement plan.
Prepare the decision before the launch
- Write the hypothesis. Use this sentence: If we change X for audience Y, metric Z moves because… Name the element that differs and the objection or confusion it addresses. The common slip is bundling unrelated changes, then expecting the result to explain each one.
- Choose the primary metric and a guardrail. Define the conversion event, eligible audience, and denominator. Add a guardrail such as refunds, unsubscribes, or revenue per visitor, with a pre-agreed action if it deteriorates. Don't switch the primary metric because another chart looks better.
- Record the baseline and worthwhile improvement. Use recent, relevant behavior from the page and audience being tested. Include the work required to implement and maintain the treatment. The mistake to avoid is borrowing a benchmark from a different funnel and treating it as your starting point.
- Calculate the sample and set a maximum duration. Enter the planned inputs into your experiment platform or sample-size calculator, then document the stopping method. Allow time for delayed outcomes to mature. If the deadline arrives without sufficient evidence, the result is inconclusive, not an invitation to keep collecting until the chart improves.
Check delivery and measurement
- Assign comparable visitors at random. Keep each visitor in their assigned experience when they return. Don't send one advertising campaign exclusively to A and another exclusively to B. That would mix the page change with the differences between campaign audiences.
- Launch both versions together and leave allocation alone. Test links, mobile display, assignment persistence, and conversion tracking before exposing the experiment to visitors. Our Preview mode is for testing; only Production mode counts visitors. Going live involves copying a code snippet onto your site, with the chat live in under 5 minutes, but installation speed doesn't determine experiment readiness.
- Read the result under the agreed rule. Evaluate the primary metric, uncertainty, guardrail, and implementation cost. Then ship the treatment, retain the control, or document an unresolved question. Save the dates, audience definition, screenshots, and tracking notes so a teammate can understand what ran.
Choose tools for those jobs, not for an attractive result screen. This comparison of conversion optimization tools can help you distinguish delivery, measurement, and customer-feedback needs.
Before launch: A teammate who didn't build the experiment should be able to read the brief and explain when it ends.
Copy this one-line brief and fill it in: Change: [A versus B]; audience: [eligible visitors]; primary metric: [conversion event]; guardrail: [protected outcome]; sample: [calculated requirement]; stop date: [fixed deadline]; decision method: [planned analysis rule].
For a social-proof experiment, start with widget off versus widget on and registrations as the primary metric. Add the calculated sample and stop date before publishing, with an explicit instruction to record an inconclusive result if the deadline arrives first.
FOMOchat offers an AI-powered social-proof and support chat widget for answering on-page questions and addressing common objections. Conversations beat notification popups when visitors still need a real answer before they convert. Visit FOMOchat to prepare a widget-on treatment, or browse our shortlist of the best website chat widgets, then compare it with your existing page using a conversion metric and stopping rule chosen before launch.