
Your campaign dashboard looks healthy. Engagement is climbing, visitors are getting answers to their questions, and the signup form is busier than it was last month. Then someone in the meeting asks the question you've been avoiding: did any of it pay for itself?
Most marketing teams answer that with a screenshot and a change of subject. Not because they're careless, but because ROI and KPIs get used interchangeably when they answer completely different questions. One tells you whether the money worked. The other tells you what to change on Monday morning. Confuse them and you'll either kill a campaign that was profitable or keep funding one that never had a chance.
Here's the plain-language version of both, the arithmetic laid out step by step, the mistakes that make the numbers lie, and a way to check whether the lift you're seeing is real.
How ROI and KPIs Differ at a Glance
Think of a football match. The final score tells you who won. The in-game stats, possession, shots on target, pass completion, tell you why the score ended up that way. ROI is the final score. KPIs are the in-game stats. A team can win on two lucky deflections and learn nothing worth repeating, or dominate every stat and still lose on a finishing problem.
Return on investment is the financial return on an investment, expressed as a percentage of what it cost. Spend $100,000 and bring back $125,000, and you've earned a 25% return. A key performance indicator is any measured number tied to a stated goal: visitor-to-signup rate, question-resolution rate, revenue per visitor, retention after 90 days.
| Aspect | ROI | KPI |
|---|---|---|
| Question answered | Did the spending earn more than it cost? | Is performance moving toward the goal? |
| Output | A percentage | A rate, count or value, usually with a target |
| Example | 25% return on a $100,000 campaign | A 2.8% visitor-to-signup rate against a 3% target |
| Timing | After a campaign or period closes | Tracked weekly or monthly while campaigns run |
| Scope | Financial result of one investment | Any indicator of progress, including leading signals |
The split shows up in how marketers work. In 2025, conversion rate was the most widely used effectiveness metric among surveyed brand marketers at 60.8%, followed by ROI and click-through rate at 57.5% each, according to Marketing Week's Language of Effectiveness survey, run with Kantar and Google. KPIs dominate the daily standup. ROI dominates the budget meeting.
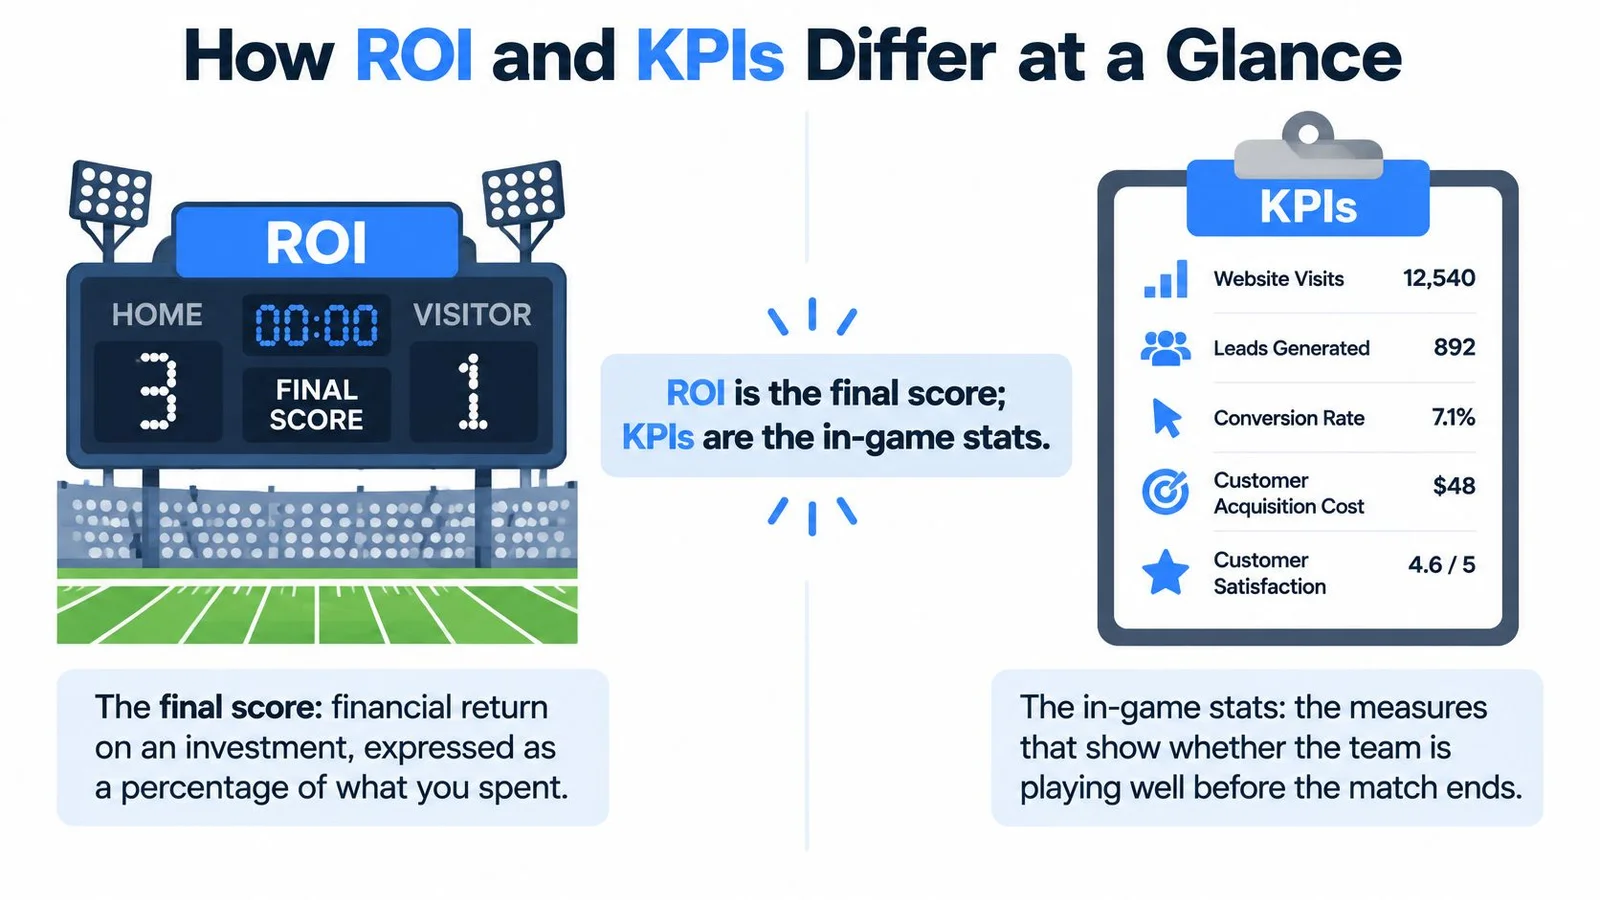
The distinction in one line: ROI tells you whether value was created, and KPIs tell you which behaviors are moving toward it. ROI is a lagging outcome, a verdict you read after the fact. Most KPIs are leading signals you can act on while the campaign is still live and still fixable.
Practical rule: Use ROI to decide where next quarter's budget goes. Use KPIs to decide what to change this week.
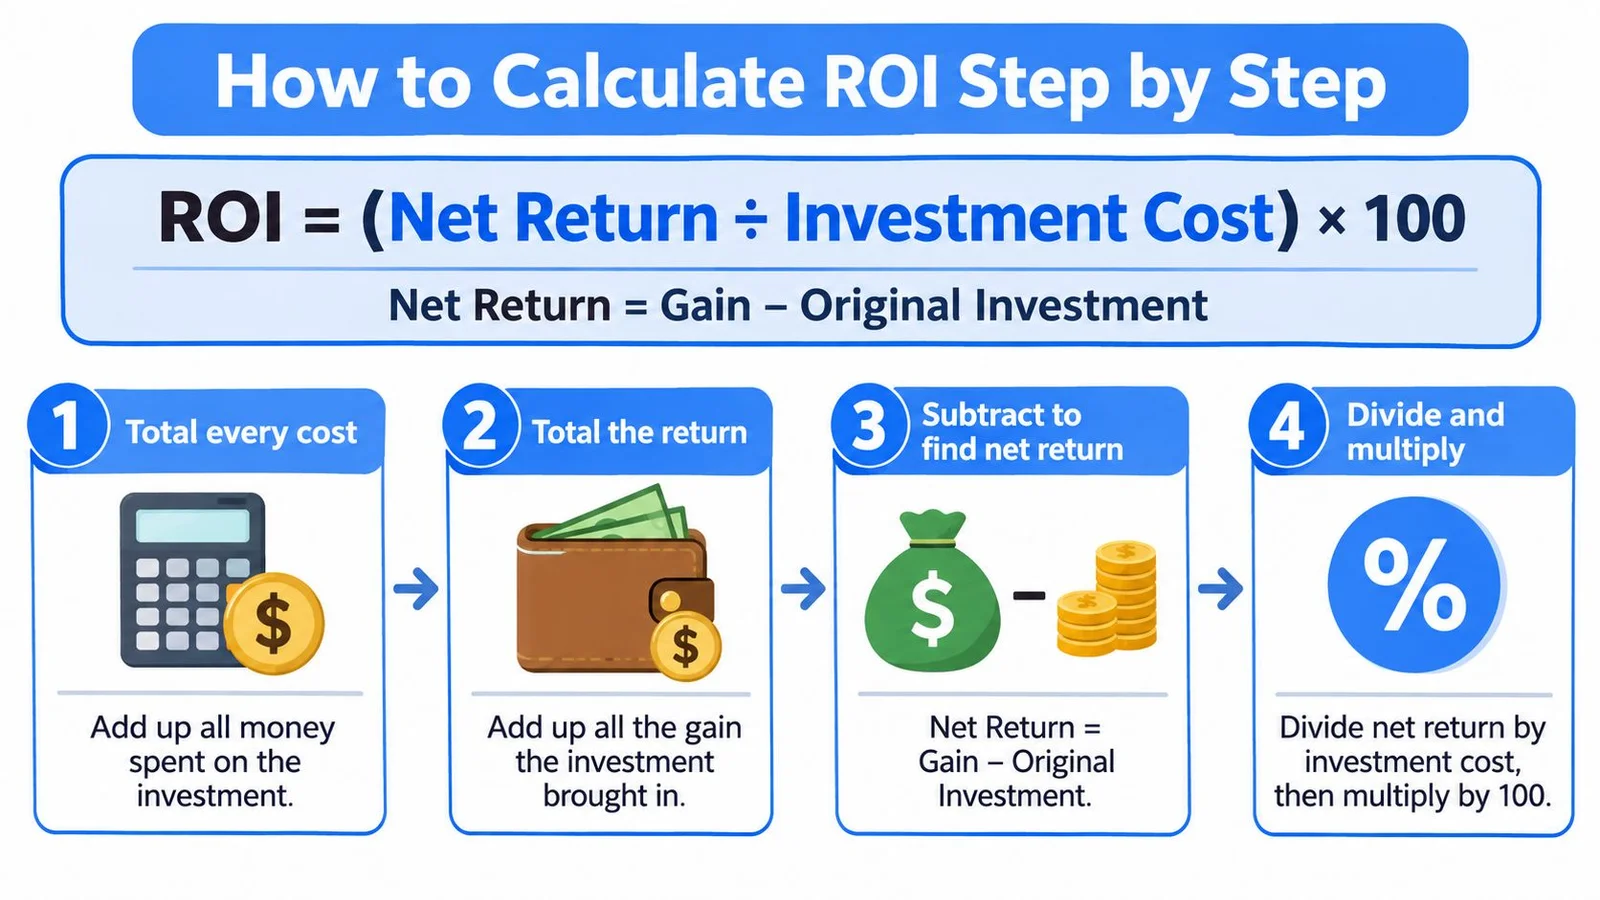
How to Calculate ROI Step by Step
A campaign costs $20,000 in advertising and $6,000 in staff time. If it brings in $36,000 in incremental revenue, did it pay off? Start by including every cost, then compare the net return with the full investment.
ROI = (Net Return ÷ Investment Cost) × 100
Net Return = Benefits − Investment Cost
- Total every cost. Include media spend, tools, staff hours, design, copywriting, and landing-page work. In this example, the $20,000 ad spend plus $6,000 in staff time makes the investment $26,000.
- Set a baseline before launch. Record conversions and revenue for a period before the campaign. The baseline helps distinguish campaign-related gains from sales that may have happened anyway.
- Estimate incremental conversions. Compare results during the campaign with the baseline. Count the increase, rather than assigning every conversion to the campaign.
- Value those conversions. Multiply incremental conversions by average revenue per conversion. For example, 120 additional sales worth $300 each produce $36,000 in benefits.
- Subtract the investment. Benefits of $36,000 minus costs of $26,000 leave a net return of $10,000.
- Calculate ROI. Divide $10,000 by $26,000, then multiply by 100. The result is about 38.5% ROI.
- State the observation period. Record whether the calculation covers 30 days, 90 days, or another period. Comparing campaigns over different time frames can distort the result.
Why the percentage is worth the trouble
A percentage makes returns on investments of different sizes easier to compare. A campaign costing $50,000 with a $10,000 net return has a 20% ROI. A program costing $10 million with a $1 million net return has a 10% ROI. The larger program produces more dollars, while the smaller one returns more per dollar invested.
| Scenario | Cost | Net return | ROI |
|---|---|---|---|
| Course launch with $125,000 in benefits | $100,000 | $25,000 | 25% |
| Small campaign with a $10,000 gain | $50,000 | $10,000 | 20% |
| Large program with a $1,000,000 gain | $10,000,000 | $1,000,000 | 10% |
What ROI leaves out
ROI does not account for time, risk, financing costs, taxes, or the opportunity cost of capital. A 20% return earned in one year and the same return earned over five years produce the same result in this formula, even though the timelines differ. Report the observation period alongside ROI, and treat the percentage as one part of the evaluation rather than the whole picture. Want more worked examples? Our walkthrough of marketing ROI calculation runs the same formula across a few channel mixes.
Choosing KPIs for Each Stage of Your Funnel
A funnel KPI should show whether people are moving toward a purchase, not just whether they are active. Awareness measures early attention; conversion and revenue measures show whether that attention produces business results. This approach echoes Kaplan and Norton's Balanced Scorecard, which groups measures across financial performance, customers, internal processes, and learning and growth.
Financial metrics show results after actions have taken effect. Customer, process, and capability measures can provide earlier signals about what may influence those results. Pairing the two helps you spot when an encouraging activity metric has not yet led to a meaningful outcome.
| Funnel stage | KPI | How to calculate | Illustrative target |
|---|---|---|---|
| Awareness | Engagement rate | Engaged visits ÷ total visits | Set from your baseline |
| Consideration | Question-resolution rate | Visits with an answered question ÷ visits with a question | Set from your baseline |
| Conversion | Conversion rate | Signups ÷ visitors | 3% |
| Revenue | Revenue per visitor | Revenue ÷ visitors | Set from your baseline |
| Retention | Retention rate | Customers active after 90 days ÷ customers acquired | 60% |
The pairing matters more than any single metric. Engagement rate is a leading signal; revenue per visitor is a later outcome it should help predict. If engagement rises for several weeks while revenue per visitor stays flat, the engagement KPI is not yet showing evidence of business value. Don't use it alone to justify a budget change. For context on how conversion rates differ across funnel stages, see this guide to funnel conversion rates.
Define each KPI's numerator, denominator, time period, data source, owner, and target before tracking it. Otherwise, an engagement count can look successful even as profitable growth stalls.
Question-resolution rate is the one teams most often skip, because nobody owns it. If visitors ask questions in a chat widget, the transcripts already hold it. In FOMOchat, for example, the AI rep answers from your own site content, and you can see which questions keep coming up and which ones never got a good answer. Our guide to conversation analytics shows how to turn those chats into a KPI you can actually track. For the retention row, these customer retention tactics for software are a good next read.
Rule of thumb: Track no more than five to seven KPIs per campaign, and place one lagging outcome beside each leading signal.
Write the definitions down before launch. That way, the team can interpret results consistently and compare campaigns without rebuilding the spreadsheet.
A Campaign Measured Both Ways
An online course team budgets $20,000 for a three-week launch and pulls in 40,000 visitors. Here's how the two measures behaved, in the order the team needed them.
By day ten, the KPI dashboard looked strong. Engagement had risen from 12% to 18% of visitors, and 85% of visitor questions received an answer. On the strength of those numbers alone, the obvious move was to extend the campaign and raise the budget.
Then finance asked for ROI, and the team had to build it properly. They had recorded a baseline before launch: 120 enrollments came in above that line. At $300 average revenue per enrollment, those incremental signups produced $36,000. Subtract the $20,000 investment and the net return is $16,000, an 80% ROI over the three-week observation window.

The numbers that changed the decision
Refunds arrived in the 30-day cohort and took back 8% of revenue. Eight percent of $36,000 is $2,880, which drops revenue to $33,120, net return to $13,120, and ROI to 65.6%. Still comfortably above cost. Not the 80% headline, though, and not a number you'd want to discover two weeks after you've tripled the budget.
That recalculation is where each measure earned its keep. The KPIs explained why the launch worked: answered questions moved hesitant visitors toward enrollment, which is why engagement and enrollment rose together. The refund-adjusted ROI proved whether it worked, after the money came back out the door.
The team's decisions followed from that split. They kept the answer-based content, because question-resolution tracked with enrollment. They cut the weakest ad set, which had driven traffic that asked questions and didn't enroll. And they set next month's budget from the 65.6% figure rather than the engagement graph. Teams that want to see how this discipline looks in real programs can study documented client results from Come Together Media, where the reporting ties spend to outcomes instead of activity.
An engagement graph tells you the room is interested. Only the refund-adjusted return tells you the room paid for the room.
Mistakes That Make ROI and KPIs Mislead
The most expensive error is treating a higher conversion rate as proof that your tool or campaign caused it. Some of those buyers were already on their way. They read the pricing page, asked a friend, waited for payday. Your widget met them at the door and collected credit for a decision made elsewhere. Notification popups are especially prone to this, since a "Someone just bought" ticker fires for everyone, persuaded or not. It's part of why notification popups fall flat for complex products, and why we built FOMOchat around real conversations instead.
The causal question is uncomfortable because it can shrink your best-looking result. A holdout test, where part of the audience never sees the campaign, separates the people you persuaded from the people who were coming anyway. Attribution data alone can't make that distinction, no matter how clean the dashboard looks.
The stakes are real for teams selling through webinars and launches. Among 227 B2B SaaS marketers surveyed by Stripo, 35% said proving ROI to stakeholders was their biggest webinar-marketing challenge, while 39% tracked leads generated as their primary metric, according to Stripo's 2025 B2B SaaS webinar survey. Lead counts are easy. Proving they turned into revenue is the hard part, which is why so many teams skip it. Our breakdown of webinar conversion rates shows what to measure between the signup and the sale.
One practical fix: measure the replay, too. A lot of registrants never show up live, so the recording carries the pitch. With FOMOchat on a replay page, later viewers see the questions earlier attendees asked and get answers on the spot. That gives you a real leading signal (questions asked and answered per viewer) to sit next to enrollments.
Six more mistakes and the fix for each
- Vanity KPIs with no revenue link. Page views and likes feel good and predict nothing. Fix: pair every engagement number with a commercial outcome measured over the same period.
- No baseline. ROI then counts sales that would have happened without you. Fix: record the prior 30 days before launch day, every time.
- Ignoring time. A 20% return in one year gets treated the same as 20% over five. Fix: always publish the observation window next to the percentage.
- Leaving costs out. Staff hours and creative production vanish from the sheet. Fix: build a cost checklist once and reuse it for every campaign.
- Different conversion windows per channel. Paid search gets 7 days, email gets 30, and the comparison is meaningless. Fix: pick one window for the whole campaign and hold everyone to it.
- One blended ROI figure with no range. The average hides the channel that lost money. Fix: report ROI by audience or channel with the confidence range attached.
When traffic is too thin for a holdout: compare matched time periods, same weekday pattern, similar promotion calendar, and say plainly in the report that the evidence is weaker than a controlled test.
Methods That Prove Causal Impact
Three measurement methods cover most of what a growth team needs, and they answer different questions. Marketing mix modeling asks how total spend across channels maps to total revenue over long horizons. Incrementality testing asks what would have happened without the campaign. Multi-touch attribution asks which touchpoints sat on the path before a conversion.
Most mature teams now run all three rather than picking one. In a 2025 BCG survey, 46% of marketers reported using all three approaches together, with privacy restrictions pushing some organizations to treat incrementality tests as their ground truth, per BCG's 2025 guidance on marketing measurement.
Fit decides which one you reach for first. Mix modeling needs a long history and suits quarterly budget splits across channels. Incrementality testing suits a single campaign with enough traffic to split into exposed and held-out groups. Attribution suits weekly tuning of bids and creative, but on its own it can't prove that anything caused the sale. If you want to understand the mechanics of the middle option, this explanation of what incrementality testing actually measures from Rapid Ads walks through the holdout logic.
Decision rule: Validate a campaign with an incrementality test before you scale it. Use attribution afterward to adjust bids, audiences and creative week to week.
When you're building the split itself, the same discipline that governs how to structure an A/B/n test applies: define the groups in advance, keep them clean, and resist peeking at results daily. And when a holdout group is too small to read, fall back to matched time periods and state the strength of the evidence in the report rather than implying a certainty you don't have.
Which Number to Trust When They Disagree
Picture the report where ROI comes in positive while engagement KPIs fell for the month. Two signals, opposite directions, and a budget decision due Friday. Which one wins?
The outcome measure wins for the budget decision. Answer-based ROI, adjusted for refunds and full costs, is the number that determines whether to spend more. KPIs are diagnostics: they tell you where to look when the outcome moves, and they're how you find the broken step before revenue catches up. A positive ROI with falling engagement is usually fine, often just a shift in traffic mix. A positive ROI reported without a control group or refund adjustment is the number to distrust.
The measurement environment makes that skepticism reasonable. In Supermetrics' 2025 Marketing Data Report, 41% of marketers said they couldn't measure marketing effectively across channels, and 66% worried about tracking users across channels. If the underlying data is shaky, so is the confident single number built on top of it.

A four-step tiebreaker
- Label the reliability. Mark each metric as directly observed, modeled, self-reported or experimentally estimated. Two "modeled" figures arguing with each other isn't a real disagreement.
- Compare against something. Put the KPI trend beside a control group or the same period last year before you draw a conclusion from the slope.
- Check the order of events. Leading signals usually move before revenue does. If engagement shifted in week one and enrollments in week three, the sequence supports a causal story. If both moved on the same day, look for an outside cause.
- Stress-test the result. Confirm the ROI survives refunds, full cost accounting and the stated conversion window before you act on it.
Where the numbers come from matters too. Brush up on attribution modeling choices so you know which model is inflating which channel, and treat any single-model result as one opinion rather than a verdict.
If ROI and your KPIs disagree for two reporting periods in a row, pause the budget change and fix measurement first. Scaling spend on a number you don't trust is how teams end up explaining a bad quarter to people who saw the dashboard.
Set Up Your First Measurement Plan
Before a campaign launches, put its measurement plan on one page. Start with the decision you need to make, then record the numbers that will help you make it.
- Name one business goal and write down the ROI formula you'll use to assess it.
- Record baseline figures for conversion rate, revenue per visitor, and average revenue per conversion.
- Choose three to five KPIs that reflect the funnel stages you're measuring. Give each one a definition, an owner, and a target.
- Set an observation window and review date. Put both on the calendar and invite the people who will assess the results.
- Write a budget rule. If ROI and KPIs disagree for two consecutive periods, review the measurement before increasing spend.
If FOMOchat is part of the campaign, compare analytics available on paid plans with registrations or enrollments recorded in your own systems over the same fixed window. Review AI-generated outputs before relying on them: they may be inaccurate or incomplete, and you are responsible for checking them. For guidance on building a measurement framework for B2B marketing, see CrowdTamers' framework. To share results clearly, use this guide to performance reporting.
Choose the campaign you'll measure first. Add its review date to your calendar today.
FOMOchat combines an AI company representative trained on your website content with interactive group chats, so visitors can get answers while seeing others ask questions. You can start with a free preview and compare paid-plan analytics with registrations or enrollments over a fixed window. Explore FOMOchat's free preview before your next launch.